
SEE CHARTS BENEATH THE REFERENCE MAP FOR FULL MAY 2025 BUNGALOW STATS BROKEN DOWN BY CITY/REGION:
- Total number of Bungalows Sold on the month
- Average, Median, Mode, Low & High:
- Asking Price
- Original Asking Price
- Sale Price
- % Listing-to-Selling Price Ratio
- Property Tax Amounts
- # of Bedrooms [Above grade level.]
- # of Bathrooms / Washrooms [Total - all levels.]
- # of Days on Market [DOM]
Get Complete Listing & Sold Info for Your Own Neighbourhood Here
See Archived Bungalow QuickStats Monthly Updates Here
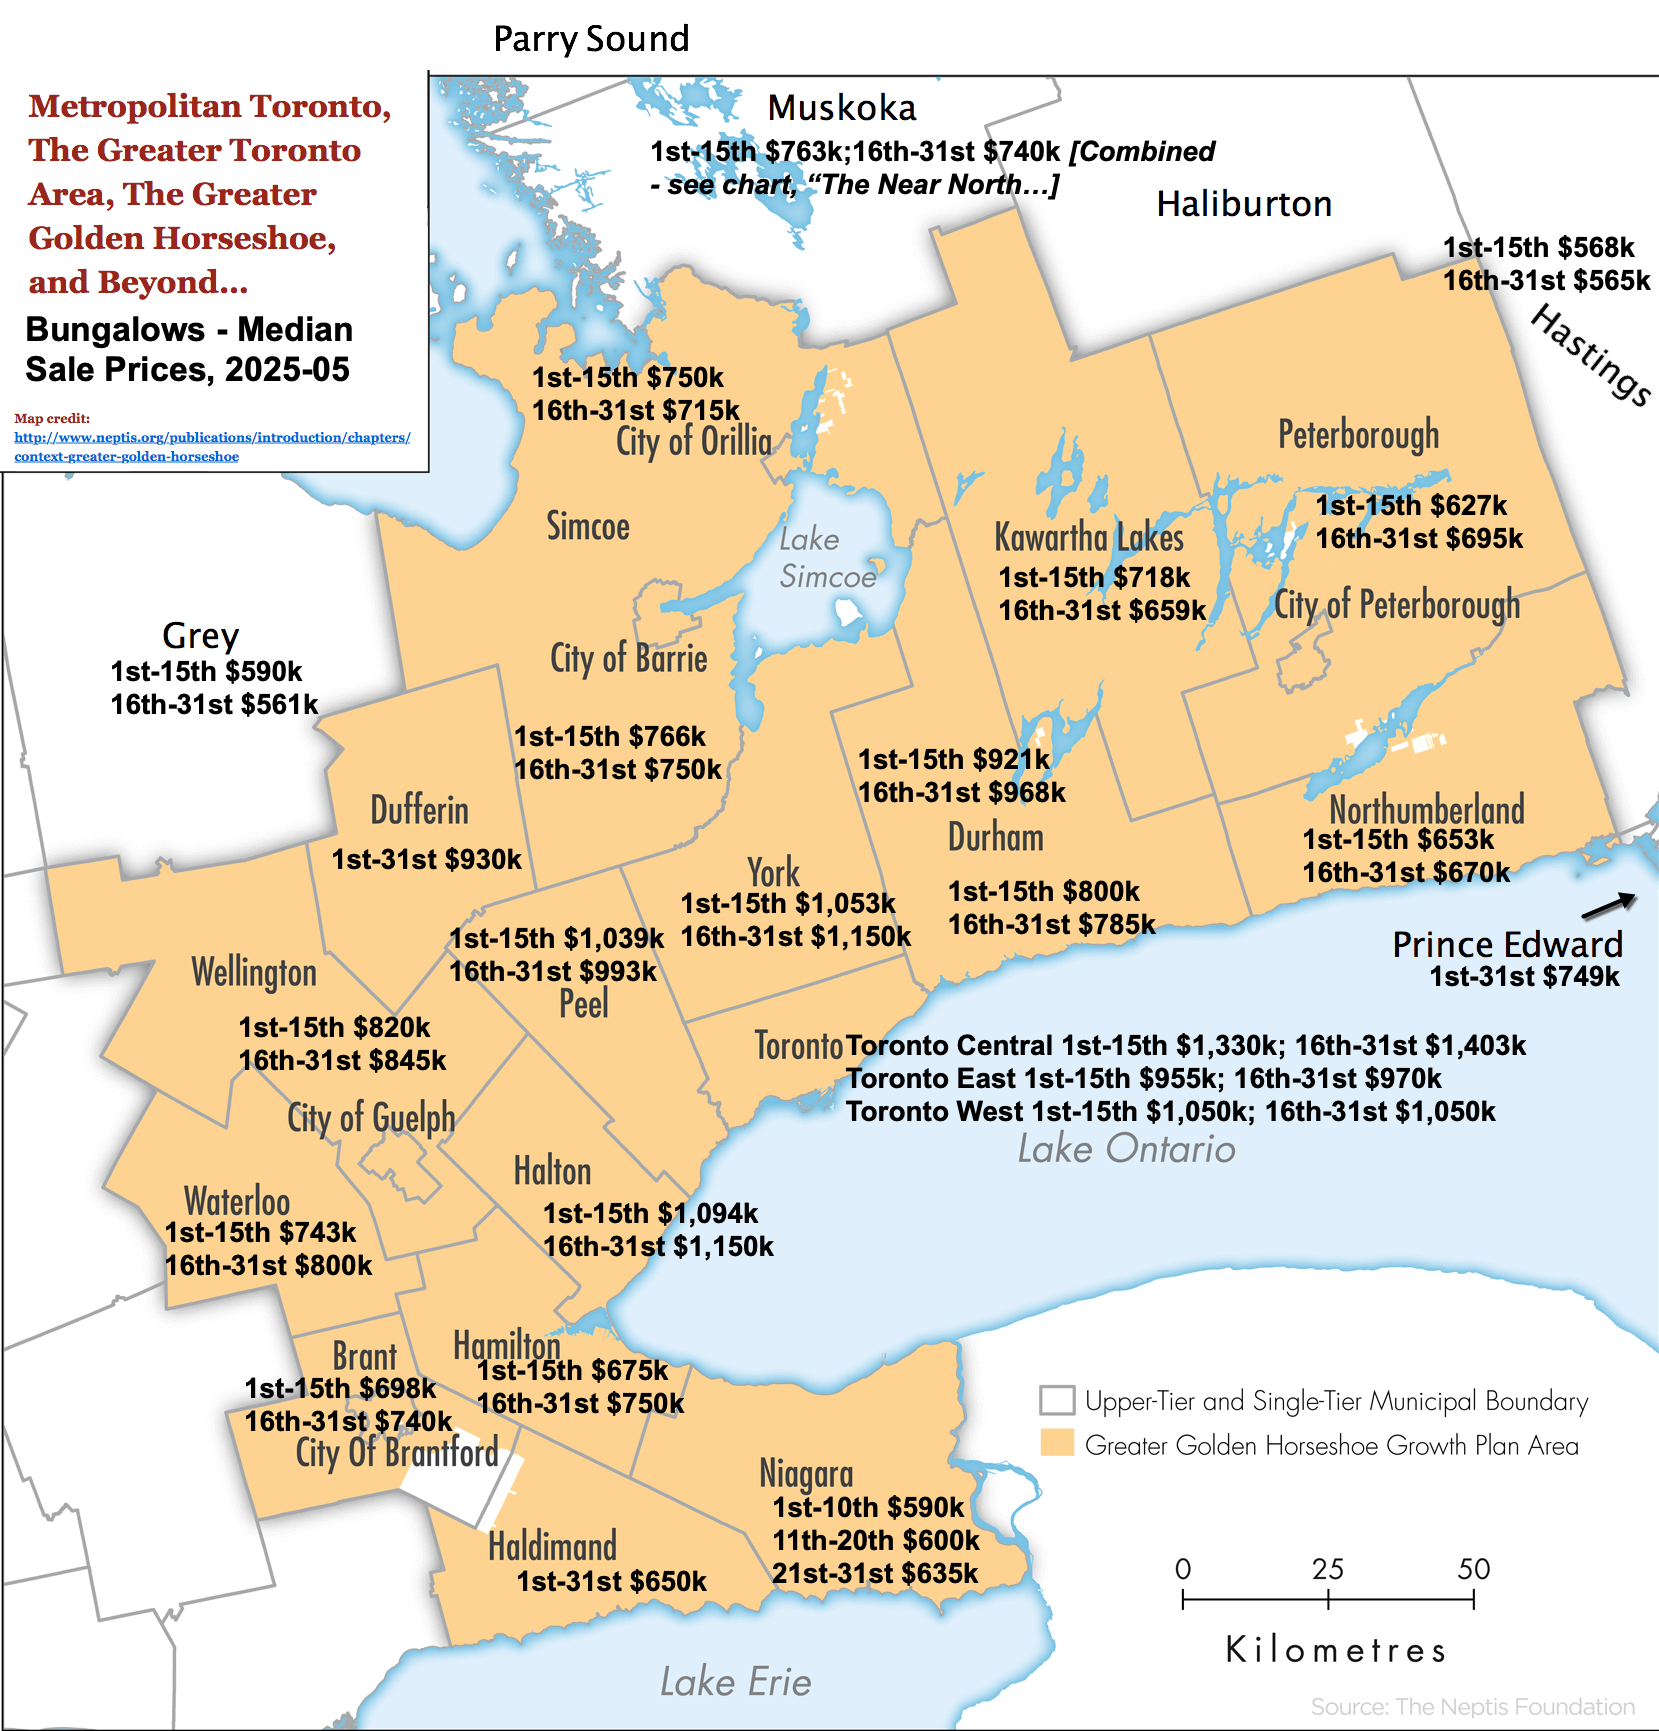
You'll notice that since the March, 2025 QuickStats update, the keymap shows Bungalow Sale Prices - generally for the 1st & 2nd halves of the month separately in each City / Region. There are a couple of reasons for this:
- Given the volatility in the markets [not to mention politics], we felt it might be interesting to see the stats divided this way.
- While mulling that option, we also discovered that a glitch in the data delivery from the TRREB MLS® System was forcing our hand regardless: Long story short, we had no choice. Niagara Region is - again - split into three segments because sales volume has been relatively high.
- In City / Regions where sales volume is particularly high or low in a given month figures may be displayed for the entire month or for portions thereof. These are also denoted below the charts. ⬇️
Browse GTA Bungalows by City / Region:
Durham Region | Halton Region | Peel Region | Simcoe County | Toronto by Boroughs | York Region
Browse "Beyond the GTA" Bungalows by City / Region:
Brant & Brantford Township | Dufferin County | Grey County | Guelph & Wellington County | Haldimand County | Haliburton County | Hamilton [City] | Hastings County | Kawartha Lakes | Kitchener-Waterloo & Cambridge | Muskoka District | Niagara Region | Northumberland County | Parry Sound District | Peterborough City & County | Prince Edward County
Notes:
Generally, because of the high volume of Bungalows for sale and sold during peak months & seasons, the following large, popular Cities, Regions & Counties are divided into north and south for statistical summary purposes:
Durham Region:
North [Brock, Scugog, Uxbridge]
South [Ajax, Clarington, Oshawa, Pickering, Whitby]Simcoe County:
North [Christian Island 30, Clearview, Collingwood, Midland, Orillia, Oro-Medonte, Penetanguishene, Rama First Nation 32, Ramara, Severn, Springwater, Tay, Tiny, & Wasaga Beach]
South [Adjala-Tosorontio, Barrie, Bradford / West Gwillimbury, Essa, Innisfil, & New Tecumseth]
With generally lower Bungalow market activity, particularly through the slower winter months, the following are combined and reported as one Area for statistical updates:
“The Near North”: Haliburton County, Muskoka District, & Parry Sound District
In months where sales volume for Bungalows is particularly high or low in a given City / Region, Median Price may be shown on the map above for the full month or - in the case of high volume - may be split into more than 2 halves. For the current month, please note:
- The following are reported as full month: Dufferin County, Haldimand County, and Prince Edward County.
- Niagara Region - due to a high number of Bungalow sales - is split into 3 time periods for the month.
#JustBungalows #theBB.group #SOTM #SingleStoreyHome #1Storey
Note: Unofficial data. Copyright TRREB, theBB.group™ and JustBungalows.com™. TRREB MLS® data. Figures may be rounded; dates may be expanded as noted. GTA/GGH… map credit: neptis.org - Map Statistics represent the MEDIAN selling price of Freehold Bungalow Style homes reported as "Firm Sales" during the time frames indicated. Other Home Types & Styles [e.g. Condominium Bungalows, Freehold 1.5 Storey homes, etc.] are intentionally excluded from this data, though may be included depending on coding of MLS® listings by individual local agents. Year-over-year comparisons often reflect adjustments due to changing Board jurisdictional / data / MLS® coverage / boundaries. For more information, please contact us. E&OE.

