
SEE CHARTS BENEATH THE REFERENCE MAP FOR FULL JUNE 2025 BUNGALOW STATS BROKEN DOWN BY CITY/REGION:
- Total number of Bungalows Sold on the month
- Average, Median, Mode, Low & High:
- Asking Price
- Original Asking Price
- Sale Price
- % Listing-to-Selling Price Ratio
- Property Tax Amounts
- # of Bedrooms [Above grade level.]
- # of Bathrooms / Washrooms [Total - all levels.]
- # of Days on Market [DOM]
Get Complete Listing & Sold Info for Your Own Neighbourhood Here
See Archived Bungalow QuickStats Monthly Updates Here
You'll notice that since the March, 2025 QuickStats update, the keymap shows Bungalow Sale Prices - generally for the 1st & 2nd halves of the month separately in each City / Region. There are a couple of reasons for this:
- Given the volatility in the markets [not to mention politics], we felt it might be interesting to see the stats divided this way.
- While mulling that option, we also discovered that a glitch in the data delivery from the TRREB MLS® System was forcing our hand regardless: Long story short, we had no choice. Niagara Region is - again - split into three segments because sales volume has been relatively high.
- In City / Regions where sales volume is particularly high or low in a given month figures may be displayed for the entire month or for portions thereof. These are also denoted below the charts. ⬇️
Browse GTA Bungalows by City / Region:
Durham Region | Halton Region | Peel Region | Simcoe County | Toronto by Boroughs | York Region
Browse "Beyond the GTA" Bungalows by City / Region:
Brant & Brantford Township | Dufferin County | Grey County | Guelph & Wellington County | Haldimand County | Haliburton County | Hamilton [City] | Hastings County | Kawartha Lakes | Kitchener-Waterloo & Cambridge | Muskoka District | Niagara Region | Northumberland County | Parry Sound District | Peterborough City & County | Prince Edward County

Browse GTA Bungalows by City / Region:
Durham Region | Halton Region | Peel Region | Simcoe County | Toronto by Boroughs | York RegionBrowse "Beyond the GTA" Bungalows by City / Region:
Brant & Brantford Township | Dufferin County | Grey County | Guelph & Wellington County | Haldimand County | Haliburton County | Hamilton [City] | Hastings County | Kawartha Lakes | Kitchener-Waterloo & Cambridge | Muskoka District | Niagara Region | Northumberland County | Parry Sound District | Peterborough City & County | Prince Edward CountyNotes:
Generally, because of the high volume of Bungalows for sale and sold during peak months & seasons, the following large, popular Cities, Regions & Counties are divided into north and south for statistical summary purposes:
Durham Region:
North [Brock, Scugog, Uxbridge]
South [Ajax, Clarington, Oshawa, Pickering, Whitby]Simcoe County:
North [Christian Island 30, Clearview, Collingwood, Midland, Orillia, Oro-Medonte, Penetanguishene, Rama First Nation 32, Ramara, Severn, Springwater, Tay, Tiny, & Wasaga Beach]
South [Adjala-Tosorontio, Barrie, Bradford / West Gwillimbury, Essa, Innisfil, & New Tecumseth]
With generally lower Bungalow market activity, particularly through the slower winter months, the following are combined and reported as one Area for statistical updates:
“The Near North”: Haliburton County, Muskoka District, & Parry Sound District [see note below].
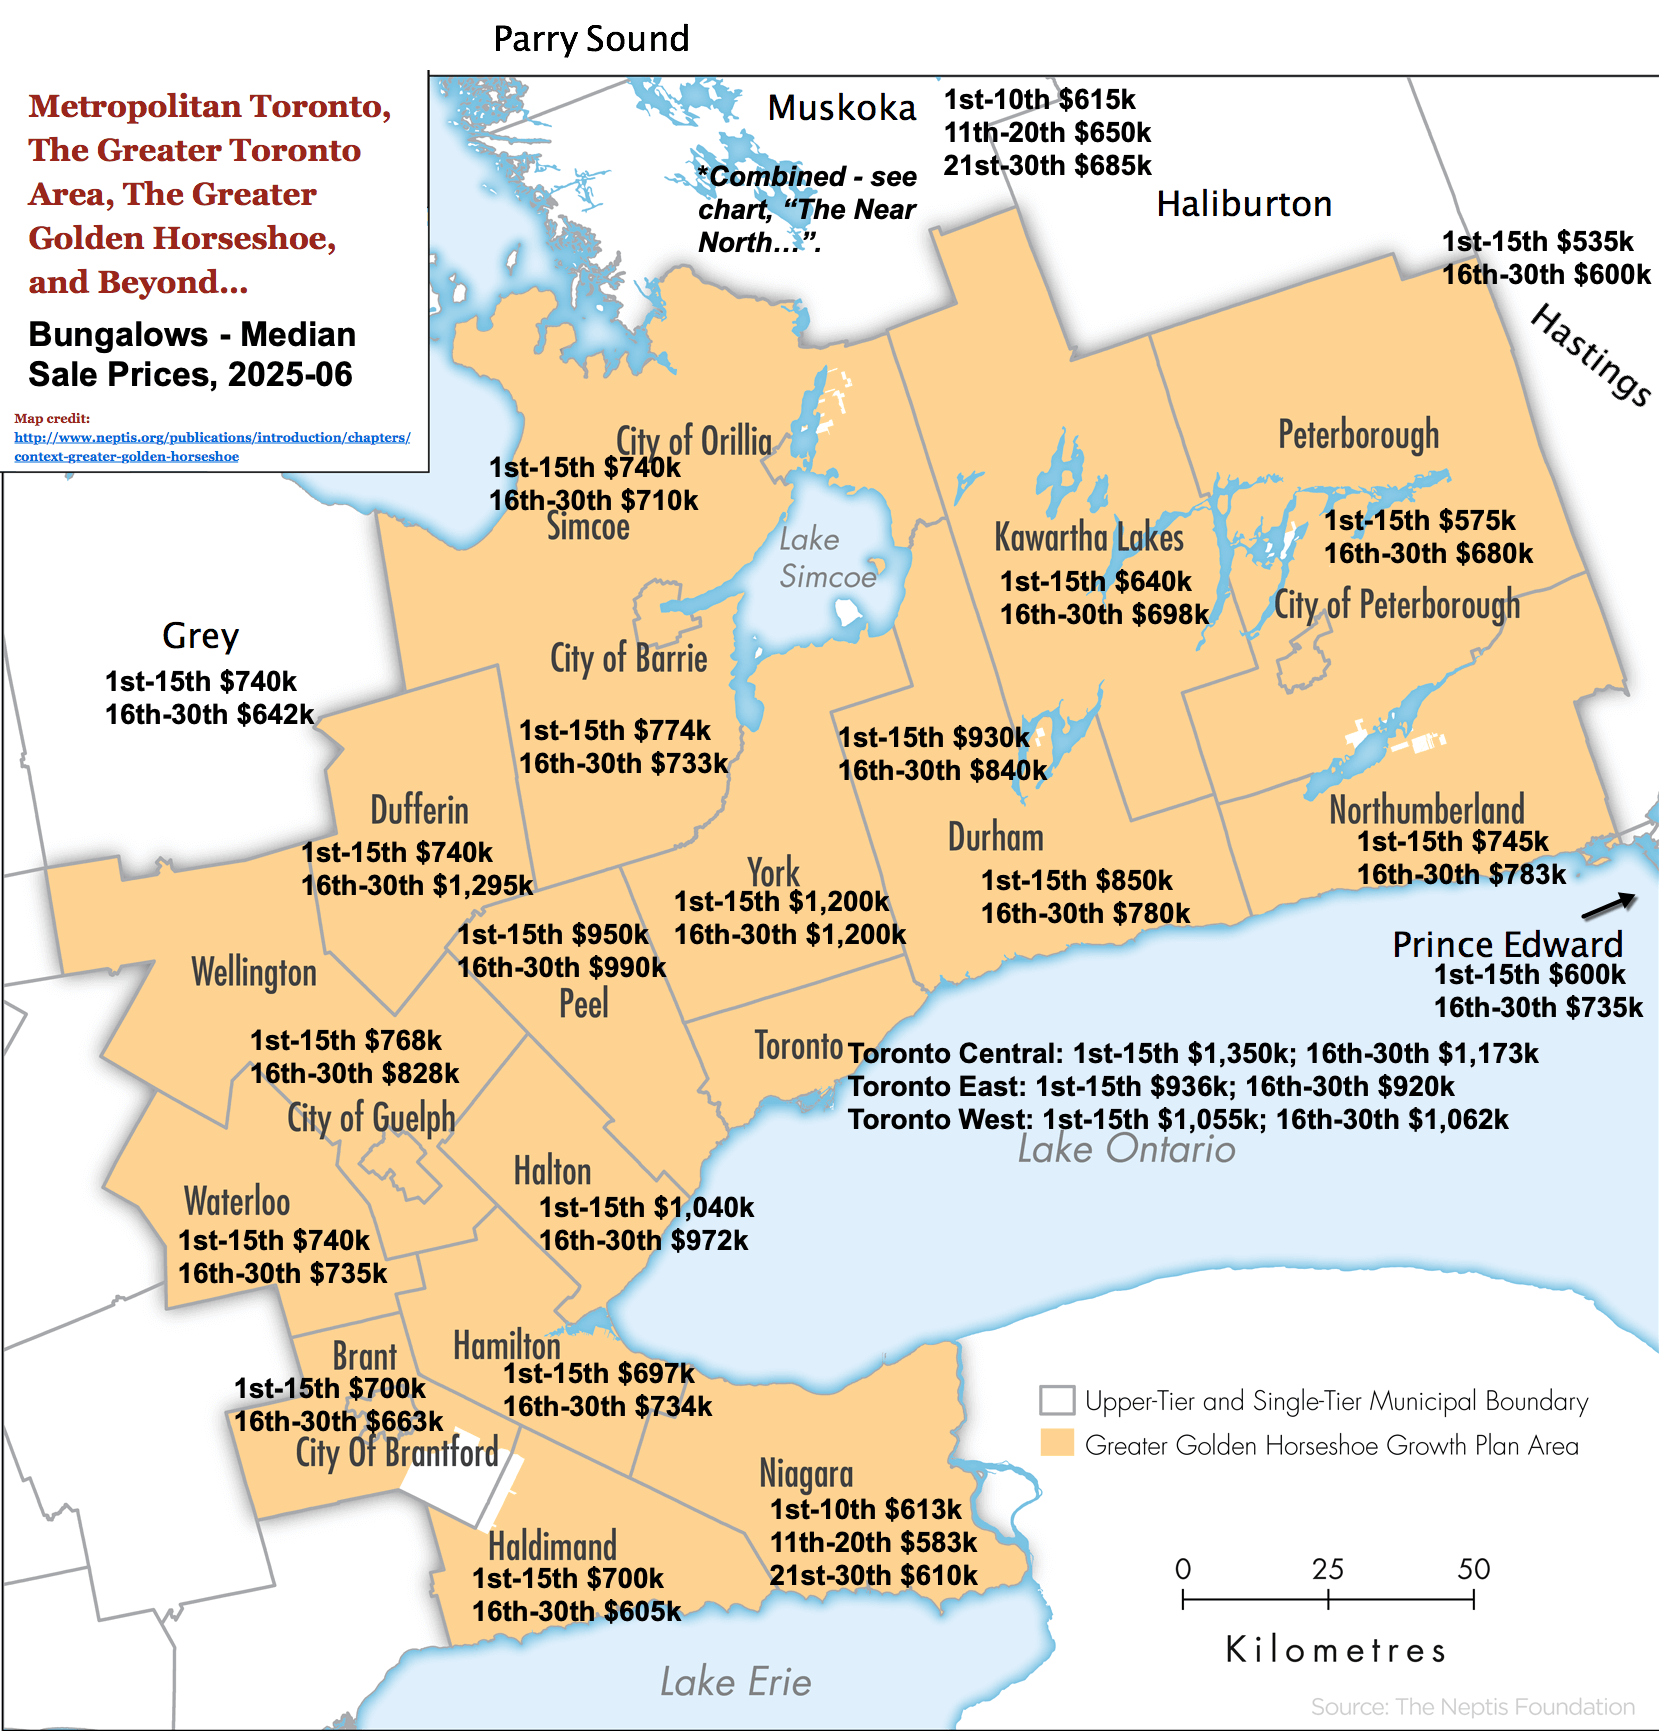
In months where sales volume for Bungalows is particularly high or low in a given City / Region, Median Price may be shown on the map above for the full month or - in the case of high volume - may be split into more than 2 halves. Some notes about this month's Bungalow statistics posts:
- The median price for bungalows fell in many areas in the second half of the month.
- Dufferin County bungalows (including Amaranth, East Garafraxa, Grand Valley, Melancthon, Mono, Mulmur, Orangeville, and Shelburne) were a notable exception. There, the median price for Bungalows sold was up 75% in the second half of the month!
- Bungalows in York Region (including the cities of Markham, Vaughan, and Richmond Hill, and the towns of Aurora, East Gwillimbury, Georgina, Newmarket, and Whitchurch-Stouffville, and the Township of King) were literally unchanged between the first and second halves of the month.
- With the addition of the Lakelands MLS® data feed, we now get a lot more information for you for the area we include as "The Near North". That includes includes Bungalows in Haliburton, Muskoka, and Parry Sound. When we post the stats for July in early August, we'll look at the possibility of splitting those into their respective areas. Not surprisingly, activity was up in this popular cottage country area of Central Ontario. In fact, activity was so high with those three areas combined that we had to split the pricing into three monthly parts. Note that prices were up consecutively for all three time frames - at least from a median price standpoint.
- I guess it shouldn't come as a surprise that other areas that have been performing relatively well of late in general - probably because of more moderate average price points being further from Toronto - have seen good summer months. They're more popular in the summer for obvious reasons. Places like Kawartha Lakes, Peterborough, Prince Edward County, to name a few. Locations like Brant County / Brantford and Hastings County - particularly the Belleville area in the case of the latter (of course!?) are also popular - at least in part because of their more moderate price points.
- Niagara Region and the northern half of Simcoe County also had to be split into three separate time frames because of sales volume for Bungalows and the Single Storey Lifestyle!
#JustBungalows #theBB.group #SOTM #SingleStoreyHome #1Storey
Note: Unofficial data. Copyright TRREB, theBB.group™ and JustBungalows.com™. TRREB MLS® data. Figures may be rounded; dates may be modified as noted. GTA/GGH… map credit: neptis.org - Map Statistics represent the MEDIAN selling price of Freehold Bungalow Style homes reported as "Firm Sales" during the time frames indicated, as of the time of posting. Other Home Types & Styles [e.g. Condominium Bungalows, Freehold 1.5 Storey homes, etc.] are intentionally excluded from this data, though may be included depending on coding of MLS® listings by individual local agents. Year-over-year comparisons often reflect adjustments due to changing Board jurisdictional / data / MLS® coverage / boundaries. For more information, please contact us. E&OE.

