
Greater Toronto, Ontario - Tuesday October 6th, 2026 - “MarketWatch”, the Toronto Regional Real Estate Board’s (TRREB’s) monthly residential market stats report was released this morning by TRREB President Daniel Steinfeld. It showed nuthin’ but “minus signs”. Not great news for the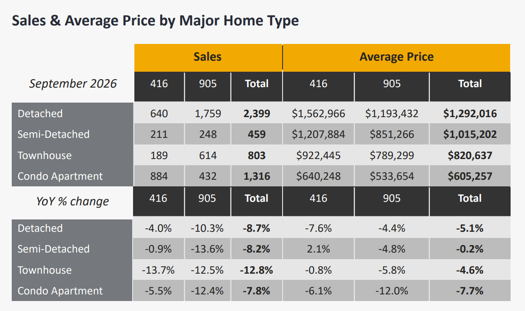 start of the Fall Market - traditionally the second strongest season of the year for area home sales second only to Spring.
The only “positive sign” in the entire report was the “Listing Days on Market” at +3%... meaning it took 3% longer to sell the average home than it did last September. Of course, “minus signs versus positive signs” depends whether you’re on the Buy or the Sell side of the market. While there’s a tremendous amount of pent up demand on both sides of the market, if someone thinks things will be cheaper next week they’re probably not buying this week.
Where that becomes a stalemate is the converse also being true - namely sellers thinking their asset might be worth more next week means they’re not selling this week. A lot of those sellers are would-be downsizers. Empty nesters looking to sell the big shack and down-shift… very often to - ideally - a Bungalow - and take some money off the table (usually tax-free capital gains in the case of a primary residence, of course) to help fund retirement.
The core issue is, of course, uncertainty. We don’t need to delve into that here: Everyone’s well aware of what’s going on in the bigger picture.
Please note that all figures quoted herein are year-over-year comparisons given the - historically, at least - strong seasonality of the residential real estate market.
The Big Picture
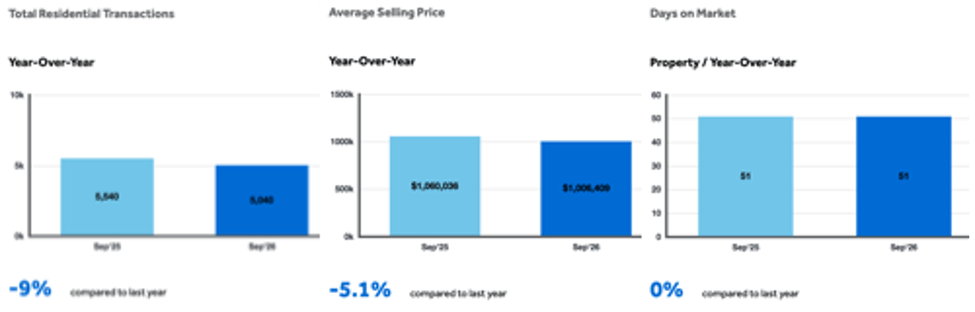
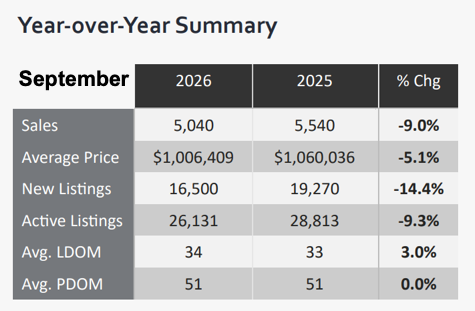 Across all of TRREB’s geographic market area & including all Classes, Types & Styles of homes, 5,040 homes went under “firm” (e.g. unconditional) Agreement of Purchase & Sale last month - 9% below last September’s total. The average sale price was $1,006,409, down 5.1%.
As noted above, there were virtually no “positive” figures in the report from a GTA home seller’s point of view. The only stats with a plus sign in front of them were the average listing days on market at +3% - which simply means it took 1 day longer than it did last September to sell the average home - and the average sale price of Semi-Detached homes in “The 905” area around Metro Toronto which eked out a 2.1% increase.
Specific Stats Broken Down by Home Type
Metro T.O. saw 640 sales of Detached homes, a 4% drop, averaging a sale price of $1,562,966, off 7.6%. The rest of the GTA saw 1,759 Detached homes go under contract, down 10.3%, averaging $1,193,432, down 4.4%.
As for Condo Apartments, Toronto “proper” saw 884 sales, down 5.5%, averaging $640,248, off 6.1%. In the balance of the TRREB’s area 432 units sold, down 12.4%, at an average of $533,654, a drop of an even 12%. Ouch.
Seemingly ever-popular, Active Bungalow listings made up about 24.5% of market inventory - but accounted for a little over 28% of sales volume.
Quotable… From the Report:
Board President Daniel Steinfeld:
“Housing is one of the biggest issues on voters’ minds, and the upcoming municipal election will help shape housing policy across the GTA and Simcoe County for the next four years. The decisions our next mayors and councillors make on affordability, housing supply and the costs associated with buying a home can also influence buyer demand and confidence in the market.”
Board Chief Information Officer Jason Mercer:
“We know there is substantial pent-up demand in the GTA, with many households fully intending on purchasing a home in the months ahead.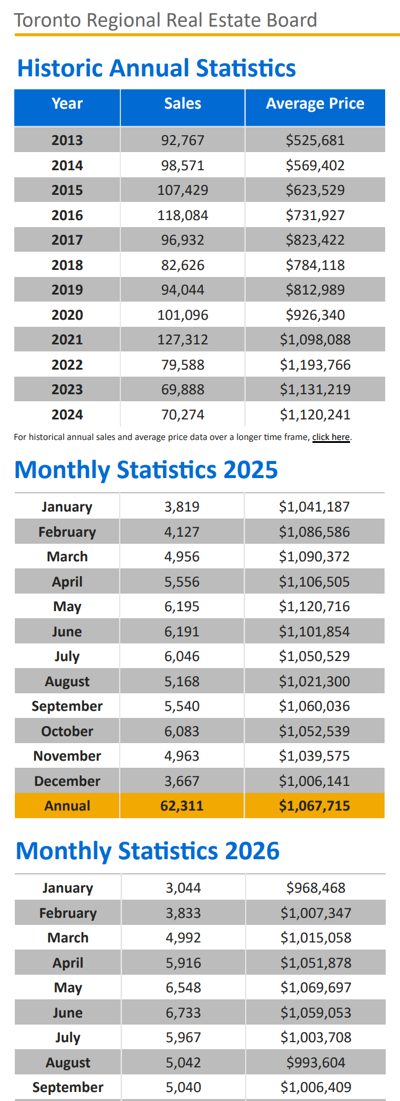 These would-be homebuyers want to take advantage of today’s more affordable housing market, but they need to be confident that their employment situation will remain solid and inflation will not put pressure on borrowing costs over the long term.”
Board CEO John DiMichele:
“Governments must make homeownership more attainable by reducing barriers such as Toronto’s Municipal Land Transfer Tax and opposing its expansion across the GTA and Simcoe County. With trade uncertainty and tariffs continuing to affect Canada’s economy, maintaining a strong housing sector is critical to supporting consumer confidence, economic growth, and the significant spin-off spending generated by every MLS® transaction.”
On Inventory…
September saw 16,500 new residential listings - a 14.4% drop. Very unusual for a September… historically speaking.
The Total Active Listings (TAL) figure - more relevant because it’s a “purer” number than “New Listings” which may or may not actually be “New” - was 26,131 at month-end - a drop of 9.3% spike YoY.
We do the (simple) “Forward Inventory” calculation for an idea of where we are now on the inventory front in terms of supply / demand and how long it would take to sell all current inventory assuming monthly sales volume were to continue at its current pace. That “Total Active Listings” stat is divided by “Total Sales Volume”. Right now that’s running at (26,131 / 5,040) over five months… and rising. Buyer’s Market territory. Getting high even by historical standards based on my 30+ years in the business. The pendulum has swung. Big time. How far can it go?
Last month - the “Dog Days” of Summer - there were actually more sales - albeit slightly. 5,057 to be exact (unadjusted). So with TAL at 24,482 that Forward Inventory stat was 4.84 months. The Fall Market traditionally starts with the passing of Labour Day but this year we got a modest rise in inventory but flat sales compared to August.
The average home sold “3% slower” in September: 34 Listing Days on the Market [LDOM] versus 33. Property Days on Market (PDOM) includes “cancelled / re-written / expired” listings - but only where the subsequent listing is with the same broker. If a Seller cancels or expires and then re-lists with a different agent / broker, those aren’t included - just to be clear.
It’s that time again… the temperature’s falling and the days are shortening. We’ll still see lots more great weather: Get out and enjoy the Fall colours before the snowflakes ❄️❄️❄️ start falling! 🍂🎃🍁🦃 As always, thanks for “tuning in”...
Andrew.
@JustBungalows @theBB.group
#JustBungalows #theBB.group #OntarioRealEstate #OntarioBungalows
Questions? Comments? ...We'd ❤️ to hear from you: You can drop us a line here!...
Set Up Your Own Customized SmartSearch
What's your property worth today?
Browse GTA Bungalows by City / Region
Durham Region | Halton Region | Peel Region | Simcoe County |
Toronto by Boroughs | Toronto by Neighbourhoods | York Region
Browse "Beyond the GTA" Bungalows by City / Region
Brant & Brantford Township | Dufferin County | Grey County | Guelph & Wellington County | Haldimand County | Haliburton County | Hamilton [City] | Hastings County | Kawartha Lakes | Kitchener-Waterloo & Cambridge | Muskoka District | Niagara Region | Northumberland County | Parry Sound District | Peterborough City & County | Prince Edward County