
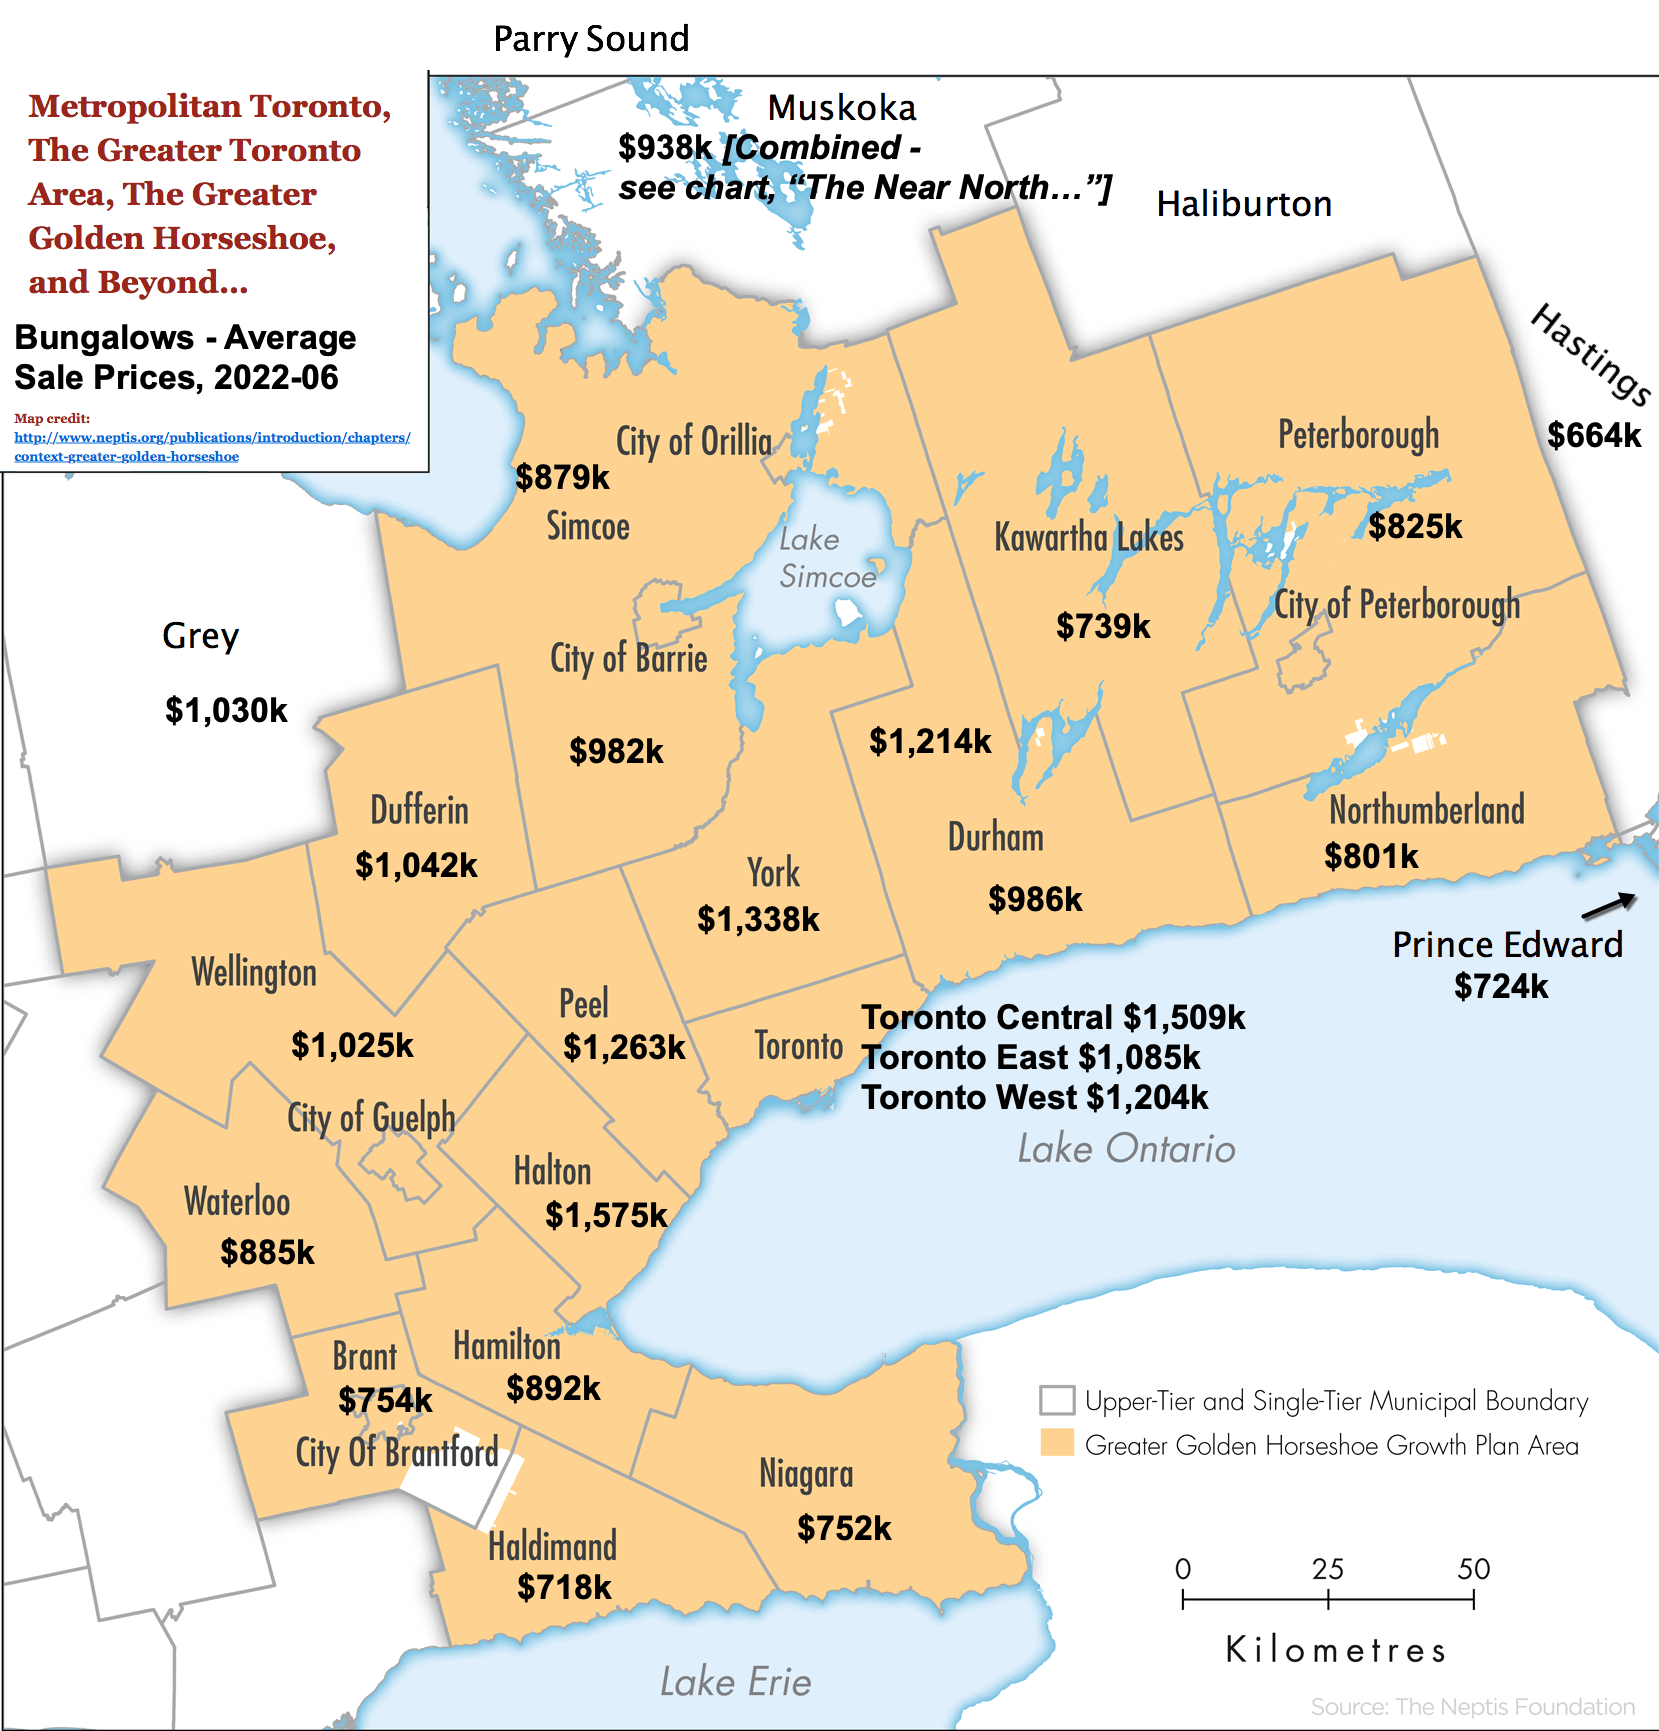
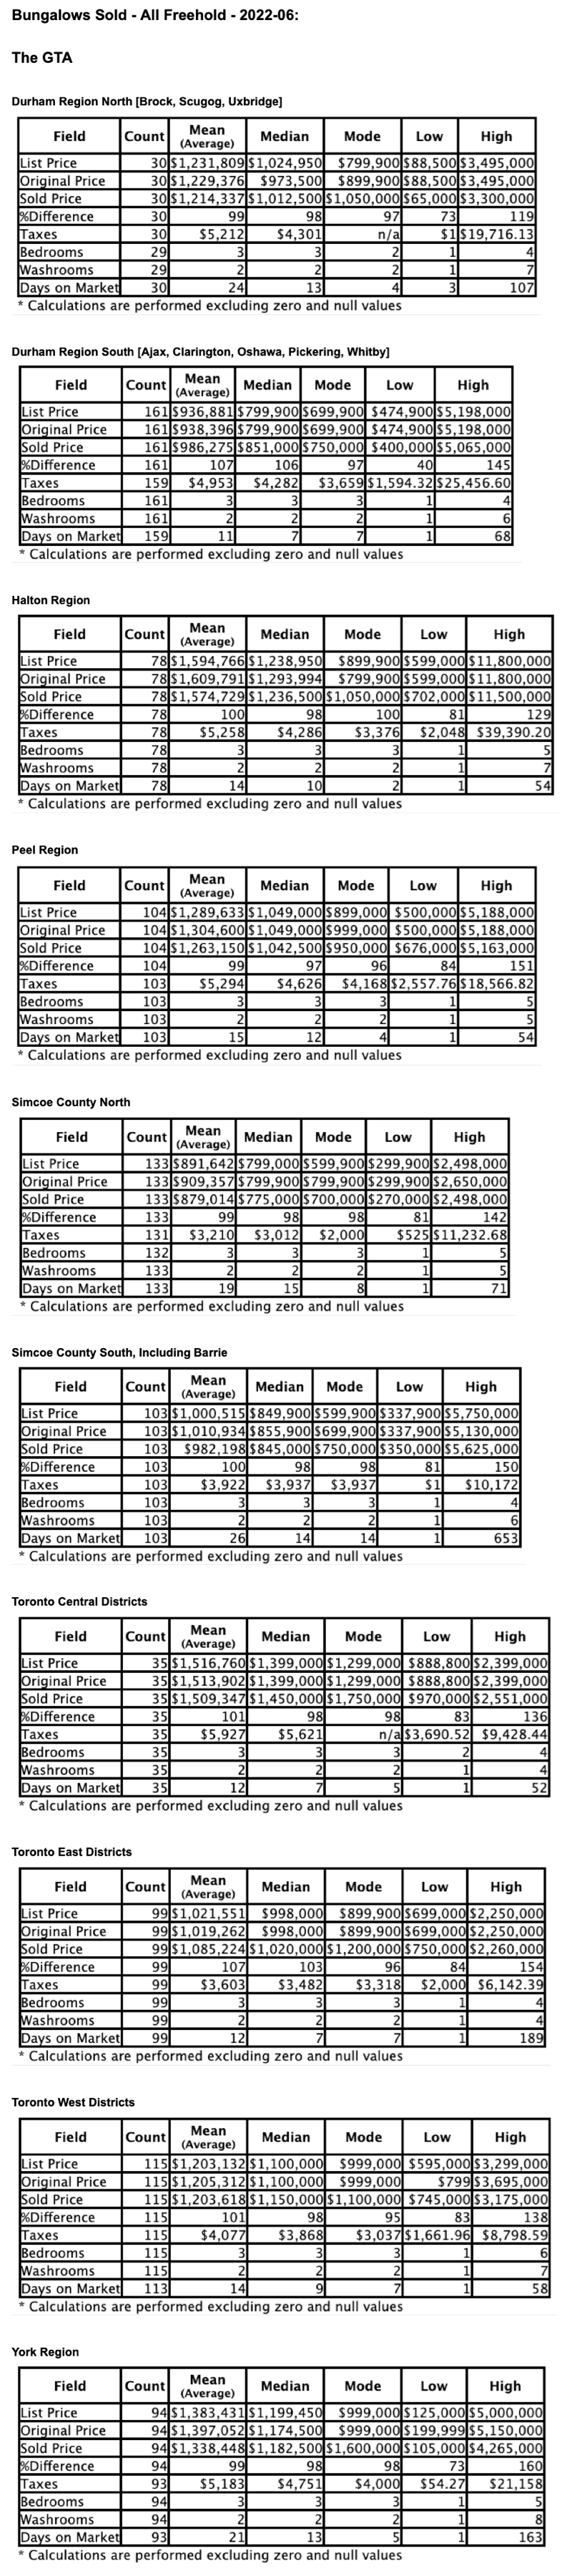
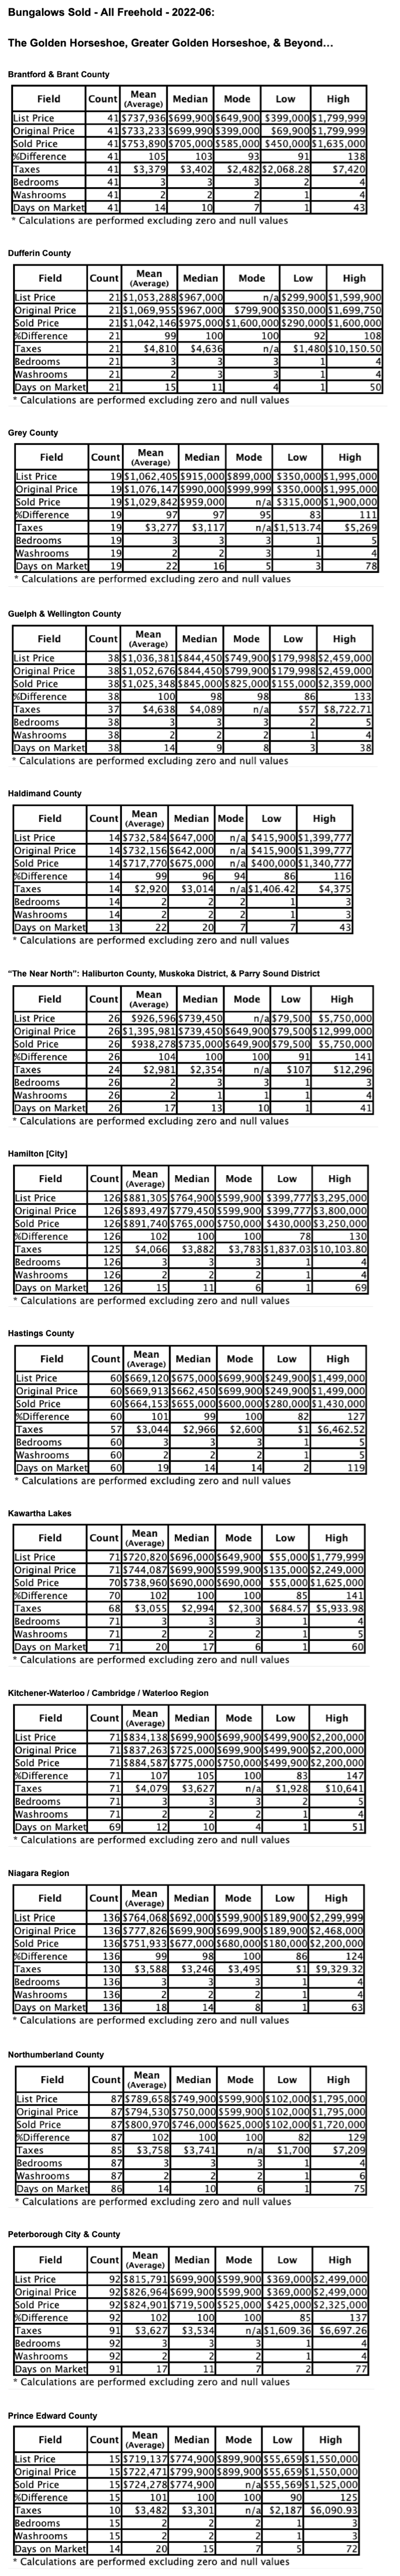
REFER TO CHARTS BENEATH THE REFERENCE MAP FOR FULL June, 2022 BUNGALOW STATS BROKEN DOWN BY CITY/REGION:
- Total number of Bungalows Sold on the month
- Average, Median, Mode, Low & High:
- Asking Price
- Original Asking Price
- Sale Price
- % Listing-to-Selling Price Ratio
- Property Tax Amounts
- # of Bedrooms [Above grade level.]
- # of Bathrooms / Washrooms [Total - all levels.]
- # of Days on Market [DOM]
Get Complete Listing & Sold Info for Your Own Neighbourhood Here
See Archived Bungalow QuickStats Monthly Updates Here
Browse GTA Bungalows by City / Region:
Durham Region | Halton Region | Peel Region | Simcoe County | Toronto by Boroughs | York Region
Browse "Beyond the GTA" Bungalows by City / Region:
Brant & Brantford Township | Dufferin County | Grey County | Guelph & Wellington County | Haldimand County | Haliburton County | Hamilton [City] | Hastings County | Kawartha Lakes | Kitchener-Waterloo & Cambridge | Muskoka District | Niagara Region | Northumberland County | Parry Sound District | Peterborough City & County | Prince Edward County
#JustBungalows #theBB.group #SOTM
Note: Unofficial data. Copyright TRREB, theBB.group™ and JustBungalows.com™. TRREB MLS© data only. Figures may be rounded; dates may be expanded as noted. Kindlky note that June, 2022 Bungalow figures are for June 1 through June 30, 2022 4:30pm inclusive due to the Canada Day holiday. GTA/GGH… map credit: neptis.org Statistics represent the average selling price of Freehold Bungalow Style homes for the time frames indicated. Other Home Types/Styles such as Condominium Bungalows, Freehold 1.5 Storey homes, etc., may or may not be included in this data. Year-over-year comparisons may require adjustment due to changing Board jurisdictional / data boundaries. For more information, please contact us. E&OE.

