Greater Toronto, Ontario - Tuesday May 6, 2025 - April, 2025 MLS® home sales statistics - as reported by Toronto & GTA Realtor® members of the Toronto Region Real Estate Board - were released this morning by Board President Elicia Barry-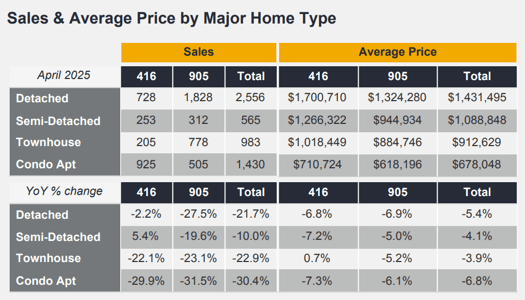 Sproule via the Board’s monthly MarketWatch report.
The “bottom line” for the April figures is pretty much “status quo” in terms of the recent trend - namely sales volume remaining soft year-over-year [though up a little from last month] in keeping with the general seasonal bias of residential real estate]; Total Active Listings inventory remaining elevated; average prices giving up some ground.
All figures reported herein are year-over-year [YoY] comparisons unless specifically noted otherwise.
The Big Picture
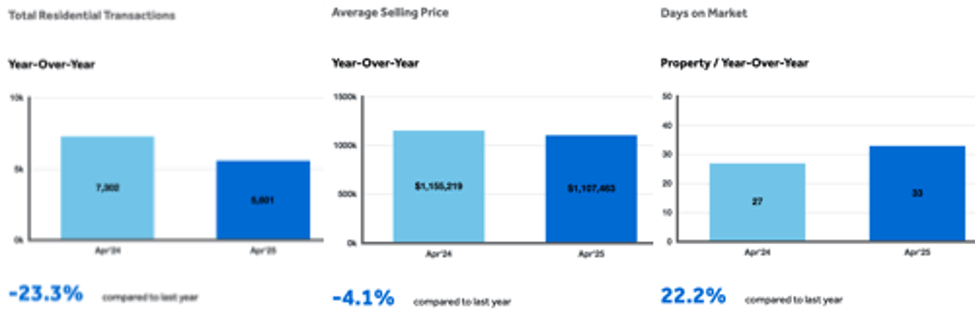
Overall - including all “Classes” and “Types” of home [e.g. Freehold, Condominium, Land Lease, etc are “Classes”; Detached, Semi-Detached, Linked, Townhome, Condos, etc are “Types] - across all of TRREB’s primary market area - 5,601 homes were 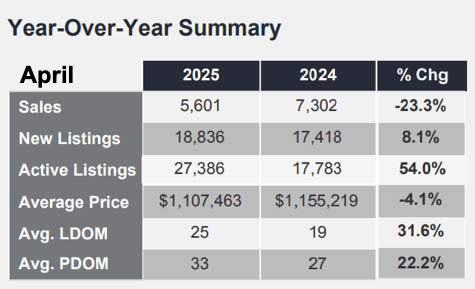 reported “sold firm” in April. That’s 23.3% below last April’s total. The average selling price of those sales was $1,107,463 - down 4.1%. All types of home saw declines in average price with the exception of Townhomes in Metro Toronto proper which eked out a gain of +0.7%.
Once again - all things considered - including “politics” - prices have held up reasonably well in our market. Even Condo apartments - sales volume for which continues to stumble hard - were pretty consistent with the broader market in terms of the softness in sale prices.
A Look at the Stats by Major Home Type
Total Detached home sales reported in Metropolitan Toronto were 728 on the month - a healthier scenario than the broader market at down only 2.2%. The average sale price in The Big Smoke came in at $1,700,710, off 6.8%. As for the rest of TRREB’s market area - “The 905” [area code], generally speaking - 1,828 sales were reported, down 27.5%, at an average of $1,324,280, down 6.9%.
As alluded to above, the Condominium Apartment market - mired in a glut of available units - continues to stumble. Sales volume [remember, we’re only talking about MLS-listed units here - though the new build market is also slow apparently] totalled 925 in Toronto, down 29.9%, averaging $710,724, down 7.3%. The rest of TRREB’s primary market area saw 505 sales, down 31.5%, at an average of $618,196, down 6.1%.
A distant memory now, the “peak” in frothy market action probably remains as February, 2022. At that time there were less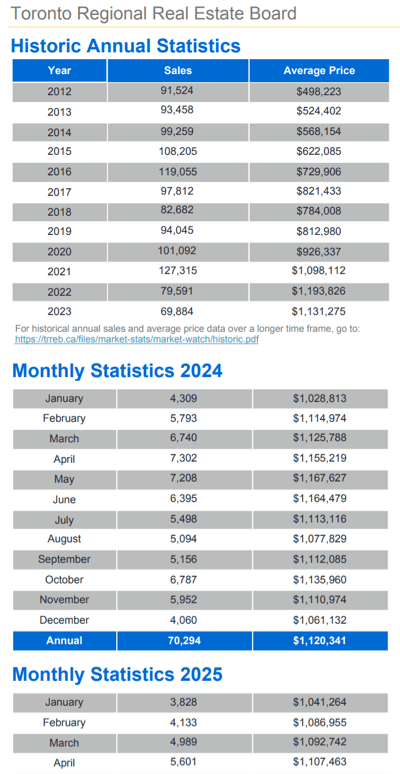 than 7,000 Total Active Listings… which sounds like a lot, but monthly sales volume was over 9,000 sales… and that was down about 17% from the prior February ['21]! But in that twelve month period - February ‘21 to February ‘22 - the sale price of a Detached home went from $1,684,073 to $2,073,989… a 23% spike in Metro Toronto. In the balance of the market area Detached homes went from $1,300,853 to $1,727,963 for a 32.9% romp. Would-be buyers throwing their hands in the air and walking away. Perhaps the yellow flag was that TAL inventory stat noted above: From that point things began to soften...
Quotable…. From the Report:
TRREB Chief Market Analyst Jason Mercer:
“Inventory levels remained elevated historically in April, pointing to substantial choice for households looking to purchase a home in the GTA. Buyers took advantage of this choice when negotiating purchase prices, which resulted in a lower average price across market segments compared to last year. Lower prices coupled with lower borrowing costs translated into more affordable monthly mortgage payments."
TRREB President Elicia Barry-Sproule:
“Following the recent federal election, many households across the GTA are closely monitoring the evolution of our trade relationship with the United States. If this relationship moves in a positive direction, we could see an uptick in transactions driven by improved consumer confidence and a market that is both more affordable and better supplied.”
Notes on Inventory…
As of the end of April there were 27,386 Total Active Listings on TRREB’s residential MLS® system. Dividing that by the total Sales Volume figure of 5,601 we get an idea of how long it would take to “clear” - e.g. sell - all the current inventory given a constant rate of sales volume. That gives us an indicated Forward Inventory of just under five months… which is definitely “Buyer’s Market” territory but, again, bear in mind that that figure is “overweight” Condo Apartments.
We mentioned above that the number of listings remains "elevated". It should be noted that our "byline" on the April 2024 statistical update was "Inventory spikes". Elevated indeed... particularly in the context of the months and years immediately preceding that time. The pendulum has most definitely swung - which it was destined to do, politics or no politics.
While inventory has climbed steadily of late as confidence quickly faded on several fronts, Bungalows and the “Single Storey Lifestyle” in general have remained in high demand - particularly in the middle and upper-middle price ranges. A big part of the driver there is, of course, Baby Boomers becoming empty-nesters and looking to downsize… preferably with as few stairs as possible. Bungalows also appeal to other market sectors like young couples wanting to exchange their Condo balcony for a real back yard… IF they can sell the Condo. Contractors are also attracted to Bungalows for the “reno & flip” potential or - with often ample lot space - expand or entirely replace the existing one storey structure - including the option to add a second storey.
To wit, we were approached in February by a retired couple in Niagara Region. They’d already sold their big house and were renting which put them in a great position to make the purchase of their “forever home” when the time was right. They decided specifically on a Bungalow in the northern portion of St. Catharines, close to Lake Ontario. After looking at many homes online, we connected them with one of our local professionals in that area and, after physically going to see another ten or so homes, they decided on a split level - in part because they couldn’t find their “match” in a single storey home.
Split level homes are often the next best choice for folks like that because, while they do have stairs between the various levels of the home, those tend to be “half” staircases of five-to-seven steps including the stairs to the basement.
So - again - a popular style of home in a good neighbourhood and at a mid-market price point, they bought it in late April… but were one of six offers on the home. They move in in June. Ironically, of all the homes they looked at both online and in person, they ended up buying on the same street as the first house they inquired about. Good neighbourhood. Location, location…!
As our local rep in northern Niagara, Nancy, put it - “Lovely folks. We looked at about 10 places. Yup, not a bungalow, but a good fit for them. They knew what they wanted: They wanted to be by the lake. Something small, manageable for retirement. Really wanted a Bungalow, but...? Almost bought a different one. It needed so much work. The Sidesplit was the right choice… and I made new friends in them. Good people!”
We love stories like that. #WinWin
Overall, it took the “average home” 25 days to sell in April. Not surprisingly given the inventory levels and, therefore, enhanced choice for home buyers, that was “31.6% longer / slower” than the year-earlier period… though still well below historical norms.
A special note from the report:
“The PropTx MLS® System, of which TRREB is a part, has added a number of new client boards over the last year. Many of these boards' Members trade within the Greater Toronto Area and broader Greater Golden Horseshoe regions. As a result, historic data have been updated to reflect the addition of these boards' listings and transactions. This means historic data have changed relative to previously published static reports. To view updated historic data, click here."
That’s good news for consumers… and Realtors® - more information from a single source, essentially. Long overdue; still a ways to go yet.
As always, thank-you for stopping by! Questions? Comments? Drop us a line anytime… And enjoy the beautiful Spring 🌱🌱🌷🌼🌞🌻😎 weather!
Andrew.
#JustBungalows
#theBB.group
Questions? Comments? ...We'd ❤️ to hear from you: Drop us a line here!...
Set Up Your Own Customized SmartSearch
What's your property worth today?
Browse GTA Bungalows by City / Region
Durham Region | Halton Region | Peel Region | Simcoe County |
Toronto by Boroughs | Toronto by Neighbourhoods | York Region
Browse "Beyond the GTA" Bungalows by City / Region
Brant & Brantford Township | Dufferin County | Grey County | Guelph & Wellington County | Haldimand County | Haliburton County | Hamilton [City] | Hastings County | Kawartha Lakes | Kitchener-Waterloo & Cambridge | Muskoka District | Niagara Region | Northumberland County | Parry Sound District | Peterborough City & County | Prince Edward County

