
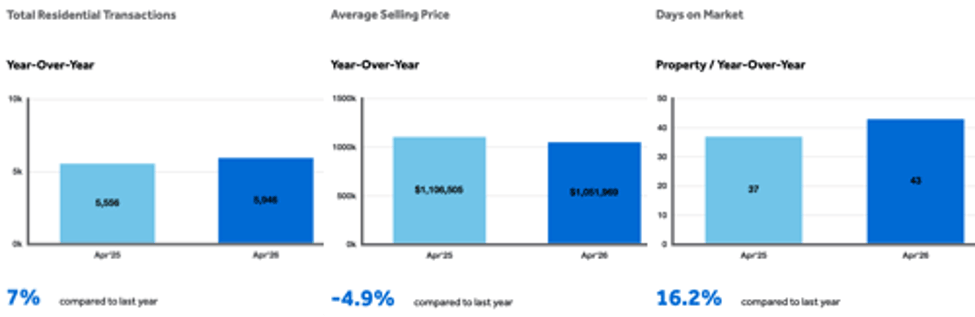
Greater Toronto, Ontario - Tuesday May 5, 2026 - Toronto Region Real Estate Board [TRREB] President Daniel Steinfeld this morning released the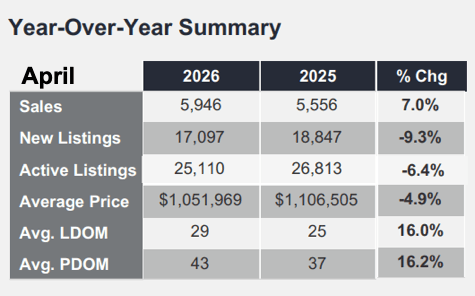 April ‘26 edition of the Board’s monthly publication “MarketWatch” giving a statistical update of residential MLS® market activity. In short, the numbers are somewhat “counter-intuitive” in that prices and inventory both came in lower than April 2025… but activity in terms of sales volume was up a respectable seven percent.
We’ll see if the numbers in the months to come get more in line with the “Statistics 101” supply / demand equation wherein - at the very least - prices should be rising as sales volume rises and inventory levels soften.
All figures reported herein are year-over-year [YoY] comparisons except where specifically noted otherwise respecting the typically strong seasonality of the residential real estate market.
The Big Picture
Overall - Including all “Classes” - e.g. Freehold, Condominium, Land Lease, etc] and “Types” of homes - e.g. Detached, Townhome, Apartments, etc] - and all of TRREB’s market area - which does, it’s important to note - change from time to time - the average home sale price was $1,051,969 in April, down 4.9%. Sales Volume on the month - MLS® sales only and not including new home builder sales unless those are listed on MLS® 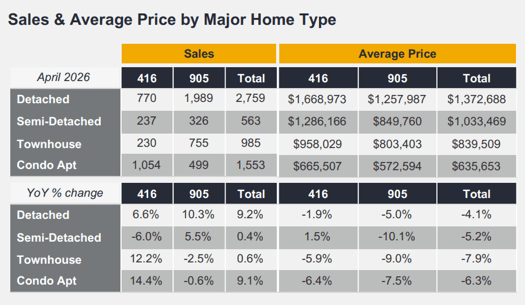 [which is actually more common in softer markets where builders seek broader expose to potential buyers] was up 7% as noted above - specifically those numbers were 5,946 this April compared to 5,556 [adjusted].
Specific Figures by Home Type
Sales of Detached homes in Metro Toronto “proper” - “The 416” [area code], generally - were up 6.6% to 770 units averaging a selling price of $1,668,973, off 1.9%. In the periphery of the city - “The 905” [area code] - 1,989 sales of Detached homes were reported on the month, up 10.3%, averaging $1,257,987, down an even five percent.
Sales of Condominium Apartments totalled 1,186 in Toronto, down 15.5%, at an average sell price of $729,392 which represents a “negative one-half-of-one-percent” change. In the rest of the market area, 656 sales were posted in March, down 7.5%, averaging $646,989, up 0.3%.
BUNGALOWS FOR SALE IN ONTARIO generally remain a hot topic as empty nesters continue to downsize - often aiming to sell larger homes in and around Metro T.O. and re-locating further afield most of the time [and taking some - usually - tax-free dollars out of the market in order to pad retirement accounts, help kids get into the market [sometimes referred to as the BOM - or Bank of Mom]].
But Bungalows also continue to gain in popularity with younger peeps looking to trade, as one example, condo balconies for back yards & decks…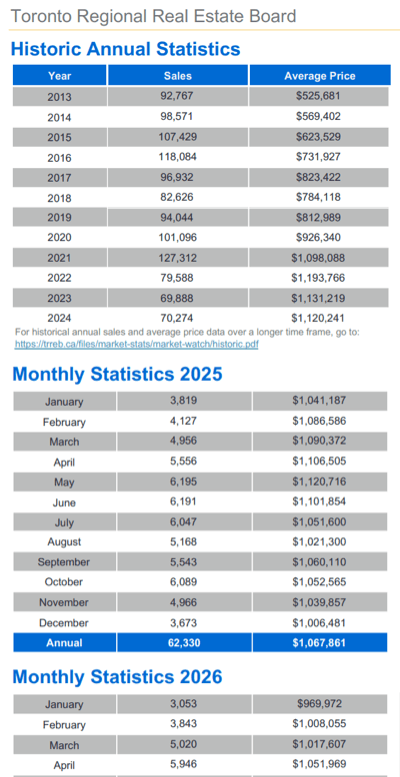 and they’ve also been for a long time popular with the contractor segment as it’s relatively lucrative to expand living space or add another unit [e.g. “In-law suite”]... or even demolish & rebuild on those generally larger lots.
In the seven days ending May 4, 2026 897 Bungalows sold thru TRREB’s MLS® System representing 26.2% of the market. Compare that to the week ended May 5, 2024 in which 549 Bungalows sold which was 21.8% of the overall market. Reminder: These stats - while we believe them to be accurate - are “unofficial”.
For more specific statistics on Toronto Area Bungalows for Sale - including much of South-Central Ontario see our “Bungalow Quick Stats” in the Resources section here at JustBungalows.com including all the numbers specific to Single Storey market activity such as Sales Volume & Prices [& % List-to-Sale price ratio, Number of Beds & Baths, Property tax, etc etc] by Area along with a map to summarize sold prices and Bungalows presently available for sale by City / Region. You’ll also find links to “archives” of that info if you’re interested…
Quotable…
Board Chief Information Officer Jason Mercer:
“Lower home prices and borrowing costs over the past year have been a catalyst for some homebuyers this spring. However, we still have a substantial amount of pent-up demand in the marketplace. More certainty on the trade front and an easing in geopolitical tensions would result in further improvements in market activity.”
[Side note: We have no idea why Mr. Mercer’s job title keeps changing but maybe we’ll come up with some stats on that next month! Last month is was “Chief Statistical Analyst” and it seems it changes regularly!?]
Board CEO John DiMichele:
“We recently released a major new housing policy report, ‘Removing Roadblocks: Tackling Municipal Barriers to Housing Supply and Affordability in Ontario,’ outlining the next phase of provincial housing policy reforms needed to build more of the right types of homes and improve affordability for Ontarians. While historic progress has been made, we must continue the work of removing the decades of legislative and regulatory red tape, outdated local rules, and rising municipal costs that are blocking new housing in Ontario. “This report is a roadmap for cutting red tape and unlocking new housing supply.”
Board President Daniel Steinfeld:
“We have experienced an uptick in home buying activity so far this spring. Buyers have taken advantage of more affordable housing market conditions on the back of lower home prices. If market conditions continue to tighten and home prices level off, this could be a signal to intending homebuyers who remain on the sidelines.”
On Inventory…
“Total Active Listings” at April month-end were 17,097, down 6.4%. Odd for “Spring Market”. “New Listings” - a “less relevant” stat in our opinion [that figure includes homes “re-listed” which can skew actual new inventory as we’ve pointed out here before] totalled 17,097 homes available for sale, down 9.3%.
“Forward Inventory” - Total Active Listings divided by Total Sales volume estimating the length of time it would take to sell all homes currently on the market given a constant rate of sales - came to 4.22 months of inventory available… that’s coming more in line with historical norms, actually.
Homes took “16% longer to sell” this April: 29 Days on Market [DoM] compared to 25. Still relatively quick by historical standards - but remember, that’s the Sold homes - it doesn’t include all the homes on the market and the “Property Days on Market” - which includes homes where the listing was terminated & re-listed - but only if that new listing was with the same Brokerage as the terminated listing - was a much higher 43 DoM indicating that “re-list” activity is “robust” as sellers cancel listings and re-list to “freshen up” their listing - usually coincident with a price “adjustment” [read “reduction”, of course]. Here’s a bit deeper explanation of the difference between the two:
“LDOM” versus “PDOM” quoted in the charts: Listing Days on Market represents the average number of days homes took to sell during the listing contract term in place when the home actually sold. Property Days on Market represents the number of days the property took to sell including previous listings with the same brokerage. Bottom line: PDOM is actually more accurate in terms of how long homes are taking to sell currently, but it’s actually an “incomplete” statistic in that it doesn’t include the days on the market in cases where a seller relists with a different broker.
As always, thanks for “tuning in”. Looking forward to getting outside as the weather warms… and the Blue Jays’ season gathers steam. 🤞🪴🌻☔️🌹🪻🥀⚾️🏟️
Andrew.
@JustBungalows @theBB.group
#JustBungalows #theBB.group #OntarioRealEstate #OntarioBungalows
Questions? Comments? ...We'd ❤️ to hear from you: You can drop us a line here!...
Set Up Your Own Customized SmartSearch
What's your property worth today?
Browse GTA Bungalows by City / Region
Durham Region | Halton Region | Peel Region | Simcoe County |
Toronto by Boroughs | Toronto by Neighbourhoods | York Region
Browse "Beyond the GTA" Bungalows by City / Region
Brant & Brantford Township | Dufferin County | Grey County | Guelph & Wellington County | Haldimand County | Haliburton County | Hamilton [City] | Hastings County | Kawartha Lakes | Kitchener-Waterloo & Cambridge | Muskoka District | Niagara Region | Northumberland County | Parry Sound District | Peterborough City & County | Prince Edward County