Toronto, Ontario, January 7, 2025 - Realtors® working in Toronto, The Greater Toronto Area, and surrounding areas of South-Central Ontario released the Toronto Regional Real Estate Board’s [TRREB] monthly statistical publication, “MarketWatch”, this morning providing a comprehensive update of residential market activity reported through the Board’s MLS® system for the month of December, 2024. Generally the report reflects largely “flat” conditions. More on those below...
Figures reported here are year-over-year comparisons - considering the generally strong seasonality of the housing market - unless specifically noted otherwise.
Overall…
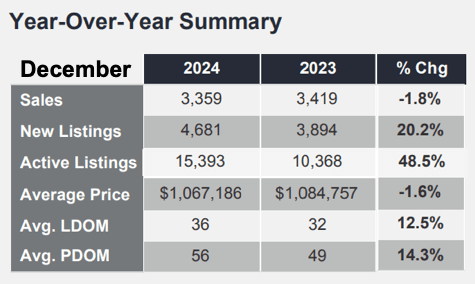
Total residential sales reported through TRREB’s System in December were 3,359, down 1.8% from twelve months earlier.
The average selling price for the month including all Classes, Types & Styles of home was $1,067,186, down 1.6%.
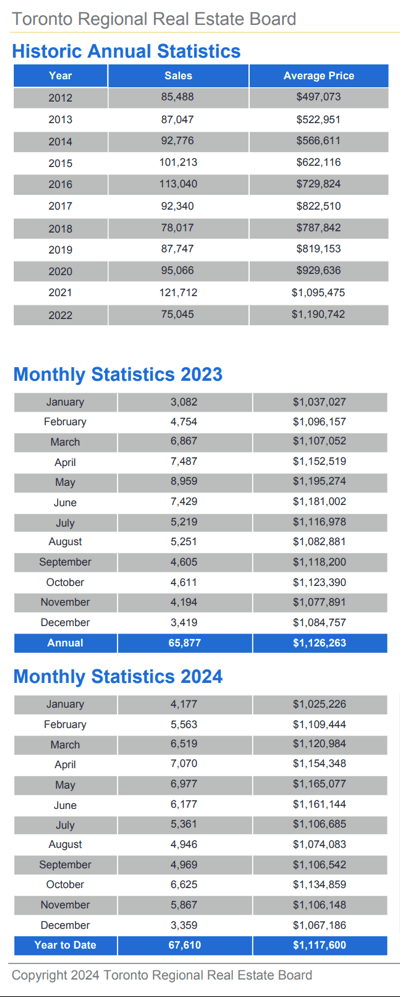
It’s worth remembering - particularly if you’re a home buyer - that “overall average peak home price” [thus far, obviously] was hit in February, 2022 at $1,334,062. While the numbers have jumped around a bit since then, that’s a pretty significant hit to those already in the market… and a welcome respite for those hoping to enter it after - literally - years of difficult conditions for the buyer side.
All in all, December was actually a decent month relative to the rest of the year and given that it’s traditionally one of the slowest months for home sales.
Specific Numbers by Major Home Type
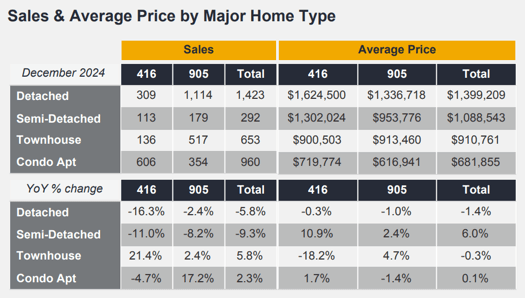
 In Metropolitan Toronto, Three-hundred-and-nine Detached homes sold in December - a 16.3% drop - at an average selling price of $1,624,500, all but unchanged at -0.3%. The rest of TRREB’s market area - “The 905” - fared a little better on the “YoY sales volume” front with 1,114 “Detacheds” reported sold, off only 2.4%. The average sale price for those came in at $1,336,718, off an even one percent.
Metro T.O. Condo Apartment sales in the MLS® system came in at 606 on the month, down 4.7%, averaging $719,774 a slim 1.7% gain. In the balance of the GTA, 354 units went under firm sale contracts, a 17.2% bump from last year, averaging $616,941, off 1.4%.
While it’s technically a home Style as opposed to a home Type, Bungalows for sale in Toronto, The GTA, and Ontario in general continue to be in relatively short supply as so many different market segments seek that coveted single storey lifestyle - and that - obviously - drives demand which drives relatively higher prices [not to mention a higher frequency of multiple offer scenarios [AKA “Bidding Wars”]] for one storey homes generally - particularly in the more mainstream price ranges and most popular neighbourhoods.
We’d also like to mention that this website - JustBungalows.com - now brings you a full national data feed. Happy “Bungalow Browsing” - but please do bear with us while we expand the pre-set searches to more areas…
Quoting from the report…
TRREB Chief Market Analyst Jason Mercer:
“Market conditions varied by market segment in 2024. Sales of single-family homes, including detached houses, increased last year, whereas condo apartment sales were down. Many would-be first-time buyers remained on the sidelines, anticipating more interest rate relief in 2025. The lack of first-time buyers impacted the less-expensive condo segment more so than the single-family segments.”
TRREB CEO John DiMichele:
“Consumer sentiment, monetary policy, development policy, and issues such as congestion continued to impact the resale, new, and rental housing markets in 2024. Government policies on these fronts need to be reviewed in 2025. TRREB is providing in-depth coverage on all of these topics in our highly anticipated Market Outlook and Year in Review report to be released at the beginning of February.”
TRREB President Elechia Barry-Sproule:
“Borrowing costs were top of mind for home buyers in 2024. High interest rates presented significant affordability hurdles and kept home sales well below the norm. The housing market did benefit from substantial Bank of Canada rate cuts in the second half of the year, including two large back-to-back reductions. All else being equal, further rate cuts in 2025 and home prices remaining below their historic peaks should result in improved market conditions over the next 12 months.”
On Inventory…
“New Listings” jumped 20.2%... but, as we’ve said here many times, that’s only part of the picture. It’s a flawed stat in a way. At least if you don’t understand it, it’s “flawed”.
Far more relevant figure is “Total Active Listings”: that stat gives a clear depiction of where we really are in terms of housing market inventory. The former shows inventory up with newly listed properties at “+20.2%”, the Total Active figure is +48.5% - nearly half again more than last year. 15,393 homes for sale versus 10,368. Let’s not forget that both those figures are light years ahead of where we were on inventory not very long ago… prompting howls of a “housing shortage”. There may be a showtime of affordable homes… and maybe in the Bungalow / One Storey homes sector of the market… but, clearly, steadily growing inventory tells its own story.
“Forward Inventory”: How long it would take to sell all the homes currently available given a constant volume of sales… Simply, Total Active Listings divided by Sales. At month-end that worked out to over four-and-one-half months of inventory available. As we asked previously, "Crisis? What crisis?"
In a relatively short period of time we’ve gone from record lows [combined with spiking prices… go figure] to a more “normal” amount of inventory that saw prices level off and even fall back significantly. But 4½ months of inventory is high by historical standards. Prices are still relatively high for many would-be buyers - particularly, of course, the younger folks. Unfortunately for the market, also relatively high is perceived / potential risk: From a - ahem - conundrum at the very top of the Country's leadership to a - ahem - conundrum at the very top of the world’s largest economy’s leadership to a - ahem - conundrum at the very top of much of the developed world’s leaderships with a hard swing to the far right…
The “Spring Market”? That actually gets into gear in the latter stages of February but - given all the - ahem - conundrums, we’ll monitor that one closely.
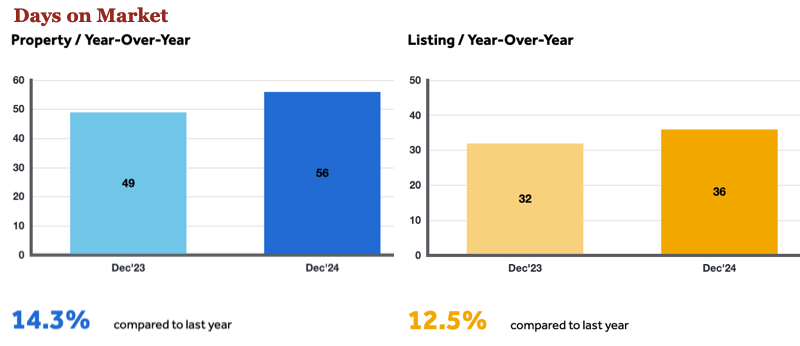
Not surprisingly looking at all the variables right now, it took an “Average 36 Days on Market” to sell a home in December, “12.5% slower / longer” than the year-earlier period. That’s the “Listings Days on Market” [“Avg. LDOM” in the chart above] as opposed to “Property Days on Market” [“Avg. PDOM” in the chart]. As explained here before, here’s the difference between those two figures:
“...the “Listing Days on Market” [LDOM] number … represents the average Days to Sell under the listing contract that’s in effect when the home actually sells. Property Days on Market [PDOM] represents the number of days the property was on market … listed more than once by the same brokerage. In other words, it’s actually a better indicator of how long homes are taking to sell… but it’s also “incomplete”: It doesn’t include time on the market in instances where a seller opts to relist with a different broker.”
Here’s a graph to give you a “visual” on the “Days on Market” [DoM]:

As always, we sincerely appreciate you stopping by. Hope your Holidays were grand however you celebrate them - and hope your 2025 is full of health, happiness and success - whatever you define that as! 🥂…
Andrew.
#theBB.group #JustBungalows
Questions? Comments? ...We'd ❤️ to hear from you: Drop us a line here!...
Set Up Your Own Customized SmartSearch
What's your property worth today?
Browse GTA Bungalows by City / Region
Durham Region | Halton Region | Peel Region | Simcoe County |
Toronto by Boroughs | Toronto by Neighbourhoods | York Region
Browse "Beyond the GTA" Bungalows by City / Region
Brant & Brantford Township | Dufferin County | Grey County | Guelph & Wellington County | Haldimand County | Haliburton County | Hamilton [City] | Hastings County | Kawartha Lakes | Kitchener-Waterloo & Cambridge | Muskoka District | Niagara Region | Northumberland County | Parry Sound District | Peterborough City & County | Prince Edward County

