
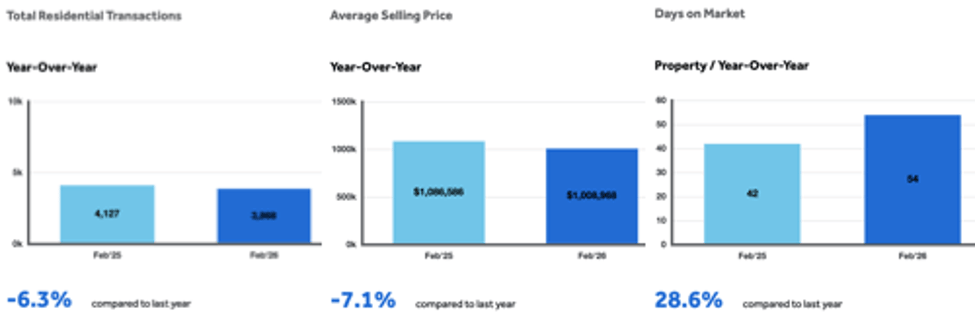
Toronto, Ontario, Thursday March 5th, 2026 - The Toronto Regional Real Estate Board - TRREB - released the residential MLS® market statistics via its monthly “MarketWatch” update today reflecting continued softness in the home market… as most were already aware.
The numbers were pretty much as might have been expected with one of the only three “+” signs in the report being the 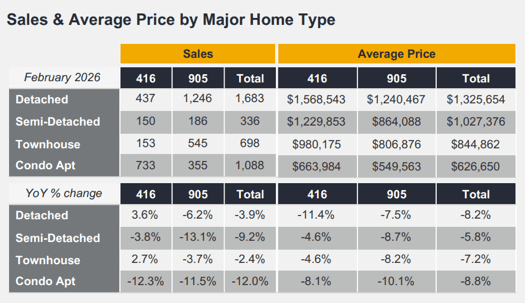 time it took to sell a home. That was higher which is, of course, actually a negative… at least from the sellers' side of the fence. From the buyers’ side the cheers go up again in hope of a return to some degree of mainstream affordability. Oh… and Detached homes and the Townhomes in Metro Toronto also managed to post marginal gains in the sales volume columns. Everything else was negative.
Much has been made of the drop in “New Listings” compared to last February. Some are even calling it a “game changer” positing that if inventory is dropping relatively hard but we still have “some” demand, then prices will stabilize and begin to rise… and we’ll be off to the races. We’re not so sure. There’s still a lot of reservations out there - everywhere but the restaurants. Jobs. CUSMA. The loose cannon. Tariffs. War. $100 oil.
Besides - as we’ve said here many a time - “New Listings” is a flawed figure compared to [Total] Active Listings. And, while the latter was also in the minus column, it wasn’t nearly as “dramatic”. 🙄 More on “Inventory” below.⬇️
Specific Numbers
Overall - all types & styles of home across TRREB’s trading area - the number of sales totalled 3,868, down 6.3%, with the average sell price clinging to that potentially psychological million dollar mark at $1,008,968. All figures provided here are year-over-year (YoY) comparisons except where specifically noted otherwise.
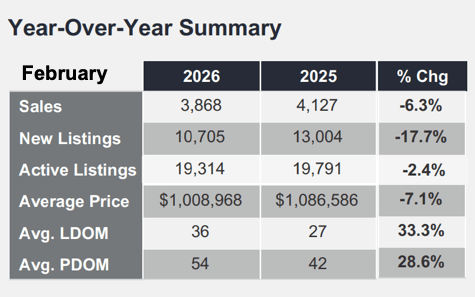 Sales in the Detached group totalled 437 in Metro T.O., up3.6%!, averaging $1,568,543, down 11.4%. Ouch. The balance of TRREB’s market area - “The 905” and parts of its immediate periphery - recorded 1,246 Detached home sales, down 6.2%, at an average of $1,240,467, off 7.5% on the month.
Condo Apartment sales continued to struggle: Toronto sales [MLS® only - stats here don’t include builders’ sales or inventory of course… but those aren’t very rosy either and many new projects have been delayed or cancelled] were off 12.3% to 733 units; beyond the city limits just 355 units sold, down 11.5%, averaging $549,563, a drop of 10.1%.
Quoting from the Report...
Jason Mercer, TRREB Chief Information Officer:
“There is substantial pent-up demand in the GTA ownership market, with more than 100,000 buyers holding off on making a home purchase. Buyers are waiting for selling prices to level off and for positive news on the trade front. Once we see both, there could be substantial momentum driving home sales in the second half of this year and into 2027.”
Daniel Steinfeld, Board President:
“Many would-be homebuyers are waiting for selling prices to level off before moving into the market. If new listings continue to trend lower through the spring, competition between homebuyers will increase, supporting home prices and a recovery in sales.”
John DiMichele, Board CEO:
“The long-term sustainability of the GTA housing market depends upon the industry’s ability to bridge the gap between 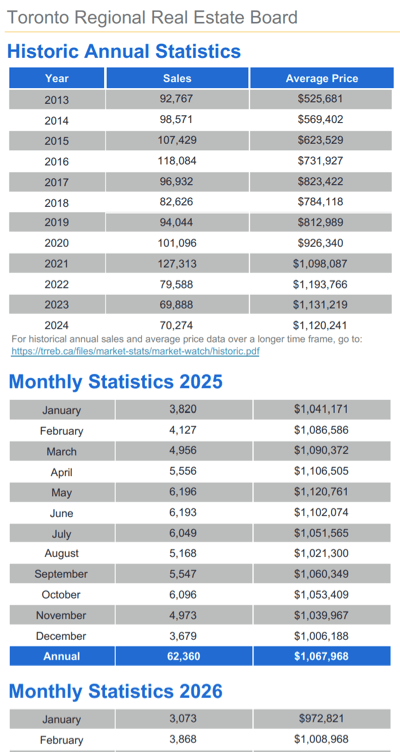 condominium apartments and traditional single-family homes. TRREB, with its partners in the Housing Advancement Coalition, is urging the Federal and Provincial Governments to take immediate targeted action to pave the way for increased ‘missing middle’ home construction."
On the all-important Inventory Front:
We're hearing it more and more and more: It's a terrible time to sell. So obviously many sellers who don't have to sell are standing pat. But the question, perhaps some aren't asking themselves, is: what if we did sell? The answer to that question for many is that they would be buying a game, and clearly the home that they would subsequently be purchasing has also fallen in value. Whatever…
Net-net, bottom line: Inventory isn't rising. Total Active Listings as of month-end was 19,314 properties available for sale compared to 19,791 last February. So based on the TAL figure, inventory’s actually pretty flat at -2.4%. But that’s unusual for February.
“New Listings” - as noted above - are the talk of the town - again, time of year no doubt plays into that narrative - were 10,705 in February, down 17.7%.
“Forward Inventory” - a “snapshot” of how long it would take to sell all homes currently listed - assuming the rate of sales remains constant (Total Active Listings divided by current monthly Sales) comes to “exactly” five months - that’s definitely on the high side versus historical norms.
The average time it took to sell a home was 36 Days on Market [DoM] which was “33.3% longer” than a year earlier based on the “Listing DoM” measure. By the “Property DoM” measure it was 54 days, 28.6% slower. For an explanation of the difference between those two “measures”, please see the “Inventory” portion of this JustBungalows Stats post.
Bungalows / Single storey Homes...
…specifically [including, of course, “BungaLofts” & “Raised Bungalows”] continue to draw a lot of attention. In fact, at the time of writing we noticed that for the week of March 2nd to March 8th [e.g. 7 days inclusive] “unofficially” 583 Bungalows sold. That was a 9.4% increase over the prior 7 days [we track these stats weekly]. Overall sales for the week - including the Bungalows - totalled 2,321 which was virtually flat compared to 2,318 in the prior period. Obviously sales of other home styles decreased on the week, the “net positive” being attributable to the popularity of one storey homes.
It should also be noted that - Bungalows being relatively scarce due to their lower new construction volume over the past several decades as buyers sought higher square footage and builders sought smaller lots and governments sought higher density… - Bungalows have tended to account for twenty- to twenty-five percent of market inventory. Again - unofficial [we have to say that!] - but the numbers above show that Bungalow sales were 33.5% of all sales. Available Bungalow inventory was about 21.2% by our figures.
Empty-nesters & “matures” downsizing. Younger couples seeking to replace balconies with back yards. Contractors looking for reno & flip or rebuild opps. Investors looking for opps that can be more easily “duplexed” - “more easily” because with Bungalows - both their basic architecture and the fact that many of the older builds had side entrances - making a “separate entry” to a lower level apartment is much simpler than with - for example - a two storey, centre hall floorplan where access to the basement is in the middle of the house.
Inventory in the one level lifestyle sector remains particularly tight. The traffic on this website is definitely up. You can find more “Bungalow-specific” stats here on our Resources-QuickStats page.
Just for the record, the other thing we’ve seen [and heard from boots-on-the-ground colleague agents] over the - “loosely”, let’s say - last week of February & 1st week of March is that things are picking up. More activity. Showings. Possibly sales. We’ll see in a few weeks. I learned a long, long time ago to not bother trying to “predict the future”, but we may be due for an uptick in residential real estate given that interest rates are still pretty low by historical standards, prices have come off their crazy February 2022 peak [though still elevated, clearly, from the standpoint of buyers entering the market], and the country thus far has - I think - been very proactive in fending off the negative impact of very strong headwinds. Pretty hard to believe that was four years ago.
Then, of course, there’s the break we’ve seen from a pretty tough winter and the welcome signs that Spring is just around the corner. Daylight savings.
Thank-you - as always - for “tuning in”! Questions? Comments - good, bad or ugly… - feel free to drop us a line anytime…
Andrew.
@JustBungalows @theBB.group
#JustBungalows #theBB.group
Questions? Comments? ...We'd ❤️ to hear from you: You can drop us a line here!...
Set Up Your Own Customized SmartSearch
What's your property worth today?
Browse GTA Bungalows by City / Region
Durham Region | Halton Region | Peel Region | Simcoe County |
Toronto by Boroughs | Toronto by Neighbourhoods | York Region
Browse "Beyond the GTA" Bungalows by City / Region
Brant & Brantford Township | Dufferin County | Grey County | Guelph & Wellington County | Haldimand County | Haliburton County | Hamilton [City] | Hastings County | Kawartha Lakes | Kitchener-Waterloo & Cambridge | Muskoka District | Niagara Region | Northumberland County | Parry Sound District | Peterborough City & County | Prince Edward County