Greater Toronto, Ontario, Friday July 4, 2025 - Toronto Regional Real Estate Board [TRREB] President Elechia Barry-Sproule This morning released the board's monthly stats update, “MarketWatch”, which summarizes residential market activity in Toronto, the Greater Toronto Area, and other parts of South-Central Ontario as reported by member Realtors® through the board's MLS® system for the prior month. With inventory continuing to rise and interest rates continuing to moderate somewhat, overall affordability has improved to a degree. Sales volume was down slightly year over year, with the only increases in sales volume coming in the Metropolitan Toronto low-rise market.
Overall…
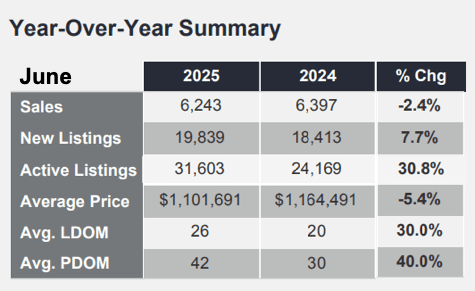
Including all Types (e.g. Detached, Condominium, Land lease, etc.) and Styles (e.g. Single story, 2 story, Split Level, Apartment, etc.) of homes, sales volume was relatively stable compared to last June: There were 6,243 sales reported on the month, down 2.4 percent from the year-earlier period. The average price of those sales came in at $1,101,691, off 5.4 percent from the adjusted $1,164,491 figure last June.
The Total Active Listings (TAL) figure is still rising, albeit at a lesser rate than we've seen over recent months. That's most likely a function of moving into the “Dog Days of Summer” -- typically one of the slower times of year, second only to December-January, generally speaking. Naturally - Supply and Demand 101 - more inventory leads to softer prices and - not surprisingly - homes taking longer to sell.
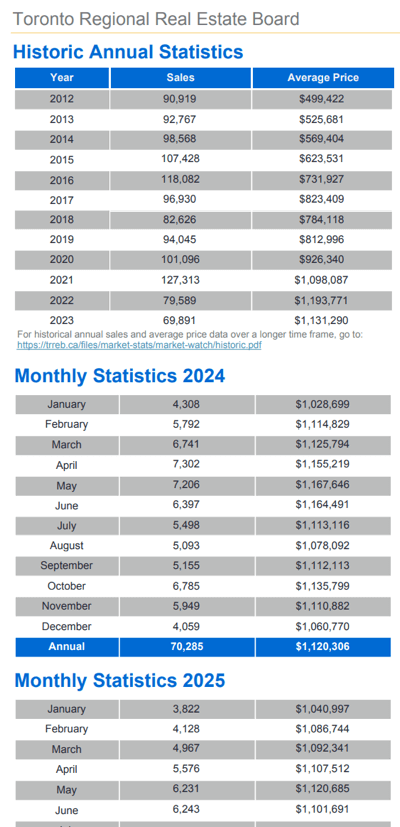
Those "overall" figures for the prior month were 6,244 sales reported at an average price of $1,120,879.
Considering the general seasonal bias in the housing market in the area, all figures reported herein are year-over-year comparisons except where specifically noted otherwise.
Specific Numbers…
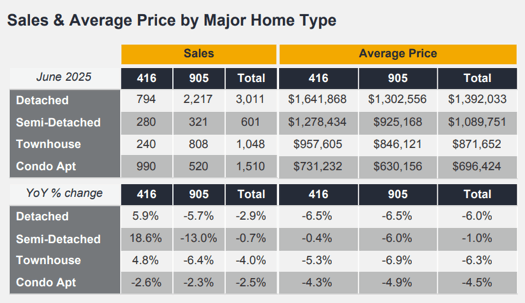
 In the city of Toronto - "Metro Toronto" - there were 794 sales of Detached homes reported at an average sale price of $1,641,868. That volume figure was up 5.9%, but the average price was off 6.5%. In the rest of TRREB's primary geographic coverage area - The GTA and parts of the Greater Golden Horseshoe - “The 905” (Area code), generally speaking - 2,217 Detached sales were reported, down 5.7 percent, averaging $1,302,556, down 6.5 percent - identical to the price drop in the city.
The Condo Apartment market in particular continues to be soft as well, though not as soft as we've seen over the past year or so: There were 990 sales reported in “T.O.”, down 2.6%, at an average of $731,232, down 4.3%. In the rest of the market area, there were 520 sales reported, down 2.3%, at an average of $630,156, down 4.9%.
Bungalows, BungaLofts and Raised Bungalows for sale - one storey homes, generally speaking - remain in relatively high demand across the market area (and beyond!) primarily because an aging population - empty nesters, “matures”, etc - looks to downsize to a smaller, more easily navigated - and maintained - style of home… and put some - usually - tax-free dollars into retirement accounts, help the kids out, and so on.
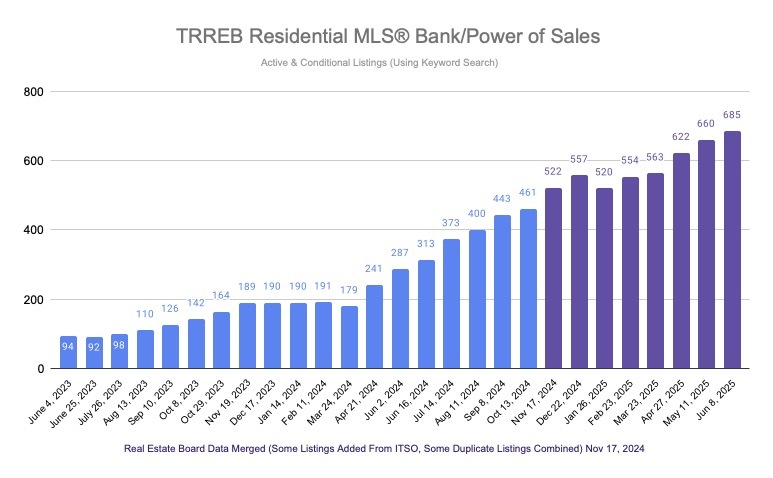
What's rather disturbing is a chart we came across - very "unofficial" data, though we have no reason to “doubt its accuracy” - of Power of Sale listings on TRREB’s MLS®. That’s a steep rise in a short period of time, no doubt contributed to by job cuts in the wake of tariffs - threatened or “real”. Please see the chart ⬇️ below.
“And I Quote…”
From this month's report:
TRREB Chief Information Officer Jason Mercer:
“A firm trade deal with the United States accompanied by an end to cross-border sabre rattling would go a long way to alleviating a weakened economy and improving consumer confidence. On top of this, two additional interest rate cuts would make monthly mortgage payments more comfortable for average GTA households. This could strengthen the momentum experienced over the last few months and provide some support for selling prices."
TRREB CEO John DiMichele:
“It is important to highlight that housing is not just impacted by economic and financial issues. Canadian residents, both homeowners and renters alike, are increasingly having to deal with the nightmare of violent home invasions and carjackings.” and “TRREB is encouraged by the recent federal announcement to table a crime bill this Fall introducing stricter bail conditions and sentencing for these disturbing crimes. While this is a good first step by the federal government to strengthen public safety, more is needed, such as working with provinces to increase law enforcement funding and improve capacity and efficiency in the court system.”
TRREB President Elechia Barry-Sproule:
“The GTA housing market continued to show signs of recovery in June. With more listings available, buyers are taking advantage of increased choice and negotiating discounts off asking prices. Combined with lower borrowing costs compared to a year ago, homeownership is becoming a more attainable goal for many households in 2025.”
Ummmm… Sure - we agree with most of what's said above, though much of that is painfully obvious. Not sure what home invasions and car jackings - as heinous as those are - have to do with the housing market directly. Anyway - onward & upward…
On Inventory…
That Total Active Listings [TAL] figure mentioned above stood at 31,603 as of month end. That’s about 31% higher than last June’s 24,169 (adjusted figure) homes for sale.
“Forward Inventory” - which simply gives us an idea of how long it would take to sell all current listings assuming sales volume continues at its present level - is arrived at by dividing TAL by the total sales volume for the month. That comes to a hair over five months: Inventory is clearly elevated by historical standards.
“Absorption Rate” indicates how fast the market “absorbs” new listings. That’s calculated by dividing the “Sales” (volume) by “New Listings”. That was .314 for June.
Homes sold “30% slower” in June: 26 Days on Market (DoM) based on “Listing Days on Market”.
Just for a little context, we whisk you back once again to February 2022 - to this point the "high water mark" in residential real estate terms for our market area. The Bank of Canada had just bumped interest rates by a quarter of a percent. The market was looking toppy - unsustainable as many viewed it, including us - and we wrote in that blog post, "...there are possibly winds of change...". Yeah. Understatement. Hard to believe that was coming up to three-and-a-half years ago. Here’s a quick rundown of the relevant housing market stats for that month as reported at the time:
- Average Overall price: $1,334,544
- Average Toronto Detached price: $2,073,989
- Average “905” / Toronto periphery Detached price: $1,727,963
- Monthly Sales Volume: 9,097 homes
- Total Active Listings: 6,985
- Listing Days on Market: 9
- Forward Inventory: “.768 of a month” (or about 3.3 weeks)
- Absorption Rate: .643 (which was actually down significantly from February 2021).
Of particular note looking at those "historic" figures is that the Average Toronto Detached home price for June of this year has fallen (significantly) below the Average "905" Detached price for February 2022.
Finally, here's that chart of TRREB MLS® Power of Sale Listing totals going back 2 years to June 2023. Again, this is by no stretch "official data"... but we have no reason to doubt the accuracy. In fact, it may be incomplete - but the data for each period shown on the chart would be consistent... meaning there's a definite "trend"...
“That’s all we got for now” - As always, thank-you very much for stopping by… Hope you’re enjoying your summer: The snow flakes will be back soon enough! 🌞🏊♂️🍉🤸🏻🪁⚾️❄️
Questions? Comments? ...We'd ❤️ to hear from you: You can drop us a line here!...
Set Up Your Own Customized SmartSearch
What's your property worth today?
Browse GTA Bungalows by City / Region
Durham Region | Halton Region | Peel Region | Simcoe County |
Toronto by Boroughs | Toronto by Neighbourhoods | York Region
Browse "Beyond the GTA" Bungalows by City / Region
Brant & Brantford Township | Dufferin County | Grey County | Guelph & Wellington County | Haldimand County | Haliburton County | Hamilton [City] | Hastings County | Kawartha Lakes | Kitchener-Waterloo & Cambridge | Muskoka District | Niagara Region | Northumberland County | Parry Sound District | Peterborough City & County | Prince Edward County

