
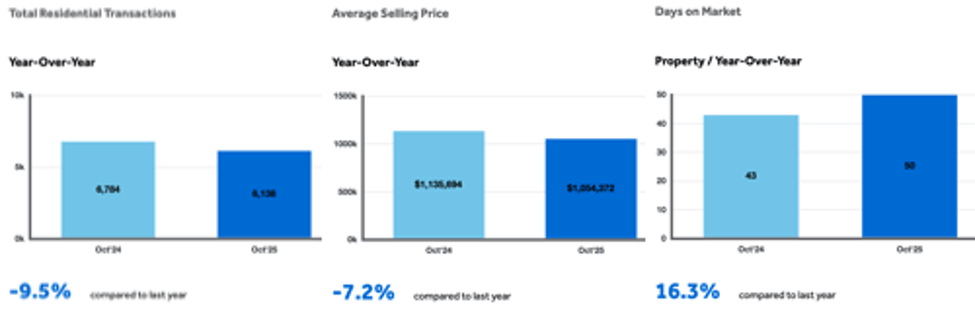
Toronto, Ontario, Wednesday November 5, 2025 - “MarketWatch”, The Toronto Regional Real Estate Board’s [TRREB] monthly MLS® residential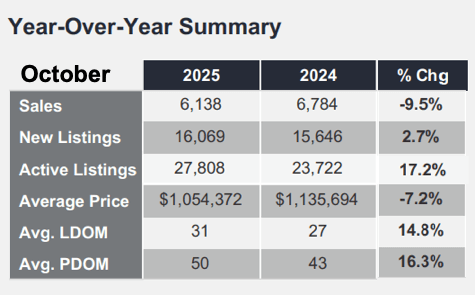 real estate market stats update for TRREB’s primary market area - generally Metropolitan Toronto, the GTA [Greater Toronto Area], and the “Greater Golden Horseshoe” region of South-Central Ontario - came out today for October showing a continuation of the recent trend, namely a softening in the sale price area and an increase in inventory / available listings area… but with significant weakening compared to the year-earlier report: Significantly lower sales volume & average price.
The year-earlier [2024] September - October periods reported sales of 4,996 and 6,658 respectively. And that October total was a 44.4% jump over October 2023 volume. All in all, the weakening market trend has gained momentum - at least in the short-to-intermediate term. Is there anything on the horizon to moderate / reverse that? Those on the Buyer side of the market hope not… as long as interest rates stay down - which is likely.
On the bigger picture “Economic Indicators” front, here are the stats for last month [‘25-10] versus the year-earlier period [‘24-10]:
- “Real GDP Growth”: -1.6% vs +2.1%
- “Inflation (Yr./Yr. CPI Growth)”: +2.4% vs +1.6%
- “BofC Overnight Rate”: 2.3% vs 3.8%
- “Prime Rate”: 4.7% vs 6%
- “5-year mortgage rate”: 6.09% vs 6.49%
Overall
TRREB’s October report - including all home classes [Freehold, Condo, Co-Op…], types [Detached, Attached / Townhome, Semi-Detached…] & styles [Bungalow / One Storey, Split-Level, 2 Storey…], showed 6,138 sales in October, down 9.5% from last October, at an overall average selling price of $1,054,372, down 7.2%.
 “New” listings were relatively flat; overall inventory [Total “Active Listings”] was - once again - significantly higher. That latter stat is the much more relevant one in my opinion. More on Inventory below.
Please note that all stats referenced are year-over-year [YoY] comparisons unless specifically noted otherwise.
A Glance at the Numbers by “Major Home Type”
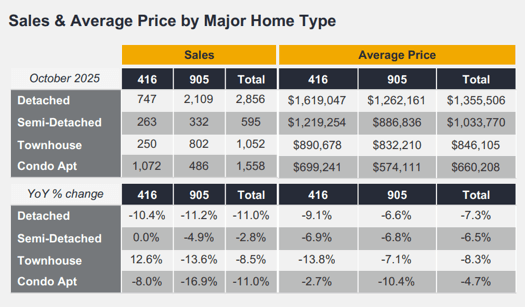
In Metro Toronto, 747 Detached homes sold last month, down 10.4%, averaging a sale price of $1,619,047, off 9.1%. In the balance of TRREB’s market area, 2,109 homes sold in the Detached group, down 11.2%, averaging $1,262,161, off 6.6%.
Condo Apartment sales in T.O. - and bear in mind these figures don’t generally include new units but are MLS®-only - which means predominantly [but not solely] resale - came in at 1,072, down an even eight percent, at an average of $699,241, down 2.7%. In the rest of the area, 486 units went under “firm” sale contract, down 16.9%, averaging $574,111, down 10.4%.
There’s been much attention of late on the saturated state of the Condominium market in terms of inventory… that had to bubble into current stats at some point… and it’s highly unlikely that trend has exhausted.
Quoting from the Report:
Board Chief Market Analyst Jason Mercer:
“The monthly mortgage payment for an average-priced GTA home continued to trend lower in October, benefitting from both lower borrowing costs, and lower selling prices. This means more buyers can now afford to purchase a home that meets their housing needs. Once we have more certainty on the economic front, including trade with the U.S. and China, home sales should increase.”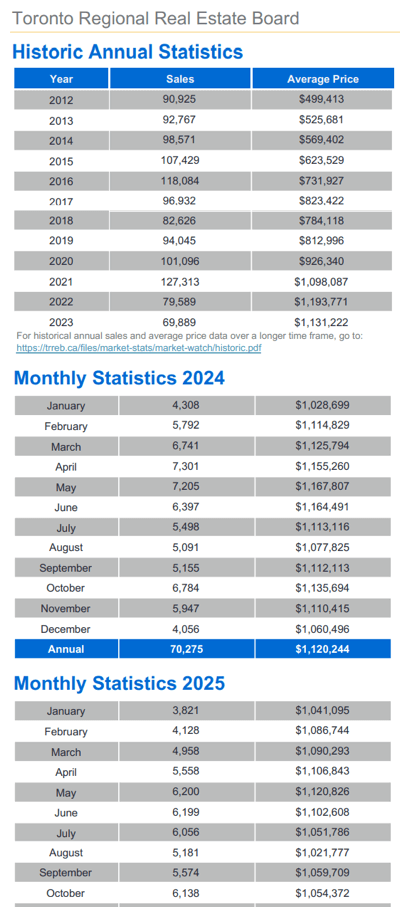
TRREB CEO John DiMichele:
“Housing is essential economic infrastructure. As the population continues to grow, innovation and private capital are required to accelerate new construction across all housing types. Governments can help by modernizing tax rules, cutting buyer costs, and ending exclusionary zoning. Working together, we can rebuild confidence, create jobs, and deliver the homes Ontarians need. We have to act now.”
Board President Elicia Barry-Sproule:
“Buyers who are confident in their employment situation and ability to make their mortgage payments over the long term are benefitting from affordable housing market conditions relative to the past few years. However, many intending homebuyers remain on the sidelines due to uncertainty about their economic future.”
Speaking of Inventory…
The all-important “Total Active Listings” (TAL) - as noted above a far more relevant; “pure”... statistic in our opinion in that it doesn’t “magnify” home listings “expired / cancelled / terminated… and then re-listed” which the “New Listings” stat does include [as “new”] - remained elevated on both year-over-year and historical bases. TAL stood at 27,808 homes for sale as of October month-end, up 17.2% YoY.
JFTR, “New Listings” were up 2.7% to 16,069.
“Forward Inventory" refers to the length of time it would take to sell all homes currently listed assuming sales volume remains constant going forward [maybe a big assumption right now]. Dividing TAL [see above] by the sales volume total [27,808 / 6,138] we get about four-and-one-half months of inventory. Still positive news for prospective buyers; we’ll see to what degree it impacts prices - obviously.
Single-Storey homes throughout the market area - and beyond - continue to be in high demand and relatively short supply. We’ve often noted that the “Matures / Empty Nesters” cohort were the biggest drivers of that - understandably - but we’re hearing more and more that Bungalows are popular with a broader and broader “audience”. Generally more modest in size, easier to look after, and often on decent-sized lots… what’s not to like?!
Thank-you so much for stopping by. Drop a line anytime with your comments, questions, requests - good, bad or ugly…!
Andrew.
@JustBungalows @theBB.group
#JustBungalows #theBB.group
Questions? Comments? ...We'd ❤️ to hear from you: You can drop us a line here!...
Set Up Your Own Customized SmartSearch
What's your property worth today?
Browse GTA Bungalows by City / Region
Durham Region | Halton Region | Peel Region | Simcoe County |
Toronto by Boroughs | Toronto by Neighbourhoods | York Region
Browse "Beyond the GTA" Bungalows by City / Region
Brant & Brantford Township | Dufferin County | Grey County | Guelph & Wellington County | Haldimand County | Haliburton County | Hamilton [City] | Hastings County | Kawartha Lakes | Kitchener-Waterloo & Cambridge | Muskoka District | Niagara Region | Northumberland County | Parry Sound District | Peterborough City & County | Prince Edward County