
Greater Toronto, Ontario - Thursday September 3rd, 2026 - MarketWatch, The Toronto Regional Real Estate Board’s monthly stats report, was released today and residential real estate market activity in August offered little in the way of surprises compared to August 2025. While it’s worth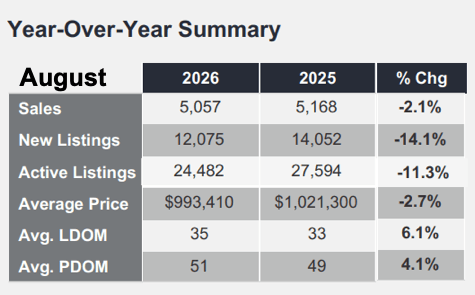 noting that the blog title from a year ago was “August 2025 Toronto & GTA MLS® home sales: Prices continue soft; Inventory rising” - with Total Active Listings up 22.4% (pretty uncommon for the "Dog Days of Summer”) and prices off about five percent compared to August 2024 - the current year-over-year scenario showed Sales Volume & Average Prices pretty flat while inventory - in terms of both “New Listings” and “(Total) Active Listings” (TAL) - continued the recent trend: “declining”.
Lower inventory clearly hasn’t manifested in higher prices as the Law of Supply & Demand suggests - likely due to soft demand in the current uncertain economic climate paired with prices that are still out-of-reach for many would-be buyers. Meanwhile, many sellers - it appears - are holding out for higher prices before making their moves. Kinda like a stalemate. And probably a situation that doesn’t favour the seller camp given job insecurity (or flat-out job losses), that pesky affordability thing, and so on.
All statistics & figures herein are year-over-year comparisons - due to the historically strong seasonality of the housing market - unless otherwise noted.
Also note that “residential real estate market activity” takes into account only those properties listed and sold on the MLS® System. Sometimes “new builds” are listed with a Realtor® on MLS® but - in a strong market - builders aren’t so willing to formally list for obvious reasons. While this has some impact on the overall inventory figures, that’s relatively insignificant. At this point in time considering the softer market conditions we’re seeing more builders resort to listing with an agent in an effort to get things moving.
Overall: The Big Picture
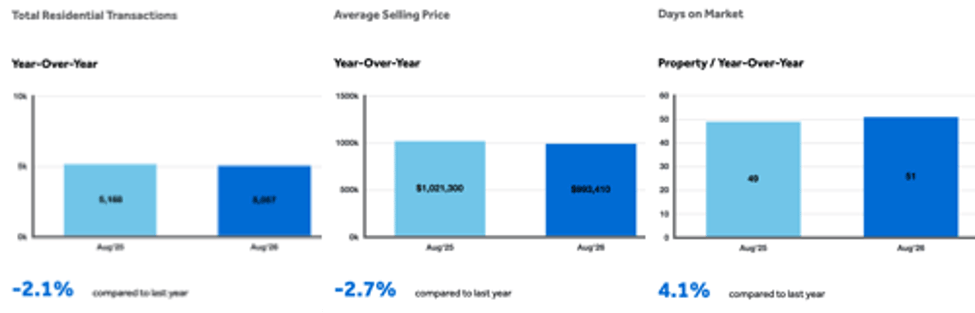
Realtors® in “Toronto, The GTA, and Beyond” reported 5,057 homes went under firm (e.g. unconditional) sales agreements in August. That was 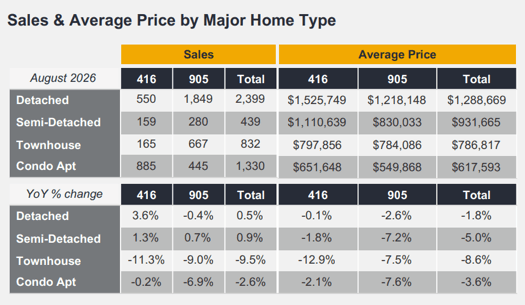 down moderately - 2.1% - YoY. That includes all of TRREB’s geographic market area and all Types & Styles of home. The Average Sale price came in at $993,410, off 2.7%.
“Just for fun” we’ve often cited here comparisons to the market peak of February 2022. “Frothy” in a word. “Unsustainable” as we said many times. “You could have a horse in the kitchen and it wouldn’t matter” as my own Bro-in-Law put it. Truer words… In that month nearly 11,000 homes went under firm “Agreement of Purchase and Sale”. More than double what we saw last month. The Average Sale price was $1,334,544. It was also around that time that another agent said to me, “Back up the truck: Buy all the real estate you can.” So goes human nature.
Detached homes in Metro Toronto jumped 23% to $2,073,989. In “The 905” area surrounding “The Big Smoke” the situation was even more outa control: Detached home prices rocketed 33% YoY. And buyers flocked.
What’s interesting is that Sales Volume was DOWN nearly 17% that month compared to February 2021. Maybe because inventory was almost non-existent. Homes were selling in multiple offer situations within hours of being listed. FOMO reigned. Wild.
Back to the present (-ish)...
Specific Numbers by “Major” Home Type
In Metro T.O. - “The 416” (area code) - 550 “Detacheds” sold, up 3.6%, at an average sale price of $1,525,749, all but unchanged at -0.1%. In “The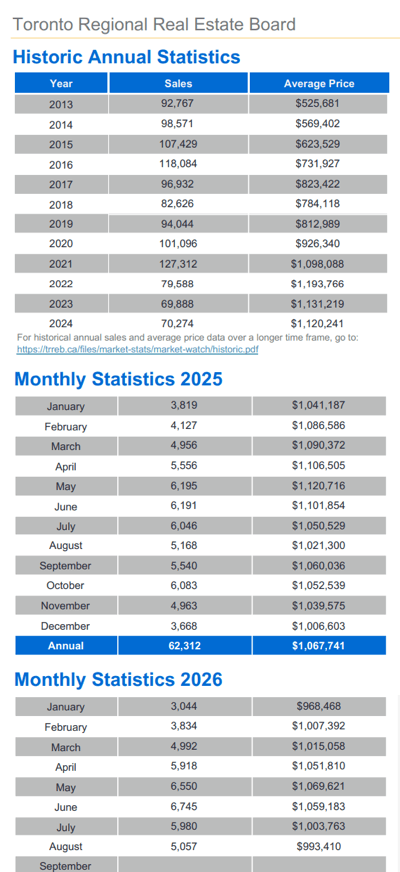 905" area code - the “balance” of the GTA (arguably) - 1,849 Detached homes were reported sold, also “all but unchanged” at -0.4%, averaging a sale price of $1,218,148, off 2.6%.
Condominium Apartment sales continued to flounder. Toronto proper saw 885 sell, “down” 0.2%, at an average of $651,648, off 2.1%. The balance of the market area saw 445 sales, down 6.9%, averaging $549,868, down 7.6%
Quoting from the Report
TRREB President Daniel Steinfeld:
"If inventory tightens and home prices begin to rise, some buyers may face a trade-off between waiting for greater economic certainty and purchasing before prices move higher. At the same time, improving market conditions for sellers could bring more listings to market, providing buyers with additional choice."
TRREB CEO John DiMichele:
"A more balanced resale market is a positive development, but it does not address Ontario’s ongoing housing supply and affordability challenges. Governments should take advantage of this opportunity to eliminate barriers to attainable housing, including restrictive zoning policies, high taxes and development charges, and lengthy approval processes. Municipalities, in particular, play a significant role in determining how much housing is built, how quickly projects move forward, and the overall cost of delivering homes."
TRREB’s Chief Information Officer Jason Mercer:
"Ownership housing in the GTA has remained relatively affordable over the past year, with average prices dipping and mortgage rates remaining somewhat flat. Recent news on the overall economy and job creation has been positive. The main hold-back for many households has been concerns around trade with the United States and the potential for higher inflation and borrowing costs in the future."
Inventory
The number of homes newly listed last month was 12,075. Total Active Listings - the more relevant stat in our opinion - stood at 24,482 homes as of month-end. The former was -14.1%; the latter -11.3%. Again - those are year-over-year comparisons.
Homes took “6.1% longer” to sell at 35 Days on Market on average versus 33 days last August. That’s the “Listing Days on Market” (LDOM) figure. The “Property Days on Market” (PDOM) came in at 51, or “4.1% slower”. The difference in the two numbers is that the latter includes homes which were listed previously, but only where that prior listing was with the same brokerage. Clearly, that's a more indicative figure than the prior.
“Forward Inventory” gives us an idea of the timeframe to sell every home currently listed - calculated as Active Listings divided by the month’s Sales Volume works out to 4.84 months. Buyer’s market territory for sure. Pricing - even when inventory’s snug - always comes down to motivation: The seller who needs to sell the fastest drops their price first, generally. That sets the benchmark.
As has been the case for a long time - and we don't see this changing anytime soon - Bungalows remain in high demand across the market area (and beyond). While Bungalows command a premium price on a per-square-foot basis - which causes some people to delay a downsize move - "no stairs" eventually leads most of these people to take the plunge, get rid of stuff they don't need, and move on to the single-storey lifestyle. For some, that's a want; for others, it's a need… a necessity.
We keep very detailed tabs - statistics - specifically on the Bungalow / One Storey home market. You can access a full month-by-month history here on our “Bungalow QuickStats” page.
It’s also not uncommon - due to even tighter inventory on the Bungalow front - for a good percentage of these folks to “compromise” and opt instead for something like a split-level home - Backsplits, Sidesplits, etc. - which usually at least don’t have the long staircases you’d find in a 2 Storey home but - instead - tend to have five-to-seven steps between the various levels of the home.
So… in closing… maybe the market’s begun to stabilize. As we noted in the title of our June 2026 post here, “A Floor Being Built?🏗️”. There are hurdles, as we’re all well aware. And lots of folks who bought in the early 2020’s are “under water”: Their mortgages are higher than the value of their asset now. But if prices stabilize and we start to see some upticks there, maybe more sellers will throw in the waiting game towel and list at market prices.
Whenever there’s a price spike in any market a good percentage of sellers go into “denial” mode and won’t sell for less than they’d seen their asset worth at the peak. Maybe. Of course, the reverse of that psychology is also true: when a homeowner sees they can get more for their asset than they would have got last month or last year, that situation starts to reverse.
We’ll see what post-Labour-Day - the start of the 2nd strongest market season of the year historically - has in store. If inventory bounces as it usually does going into the Fall Market BUT Buyers don’t follow, it’s all but a given that prices continue to soften.
Thank-you - as always - for stopping by. Now, get outside. There’s lots of great weather to enjoy before you-know-who shows up! ❄️🥶🌞😎
Andrew.
@JustBungalows @theBB.group
#JustBungalows #theBB.group #OntarioRealEstate #OntarioBungalows
Questions? Comments? ...We'd ❤️ to hear from you: You can drop us a line here!...
Set Up Your Own Customized SmartSearch
What's your property worth today?
Browse GTA Bungalows by City / Region
Durham Region | Halton Region | Peel Region | Simcoe County |
Toronto by Boroughs | Toronto by Neighbourhoods | York Region
Browse "Beyond the GTA" Bungalows by City / Region
Brant & Brantford Township | Dufferin County | Grey County | Guelph & Wellington County | Haldimand County | Haliburton County | Hamilton [City] | Hastings County | Kawartha Lakes | Kitchener-Waterloo & Cambridge | Muskoka District | Niagara Region | Northumberland County | Parry Sound District | Peterborough City & County | Prince Edward County