Toronto, Ontario, January 3, 2018 - Toronto and Greater Toronto Area Realtors® today released their MarketWatch statistical publication for the month of December, 2017 showing that the trend of recent months remained - more or less - intact: A softening market with rapidly rising inventory of available properties. 2017 - as far as residential real estate went - came in like a lion and went out like a lamb. 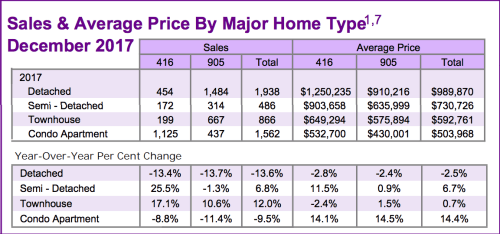
Further, with the government’s widely publicized “mortgage stress test” coming into effect January 1st, some of those planning to buy a home in the first portion of 2018 probably moved their purchases forward and already bought in the closing months of ’17...meaning the new year may start off even softer than it otherwise would have. A continued rise in interest rates is likely another headwind to consider.
Economics 101: Supply versus Demand
The most prominent statistic in the report is the inventory: The number of homes for sale…which is primarily represented by two statistics:
- The number of new listings: +50%. In percentage terms at least, quite possibly a new all-time high for December.
- The Total Active Listings: +172.4%. In percentage terms at least, quite possibly a new all-time high, period.
Overall, the number of homes sold in December was down 7.1% to 4,930 from 5,305 in December, 2016. Another trend of late has been the support of that overall sales figure by the Condo Apartments sector…but that was actually down 9.5% in December to 1,562 units. All figures herein are year-over-year comparisons unless otherwise noted.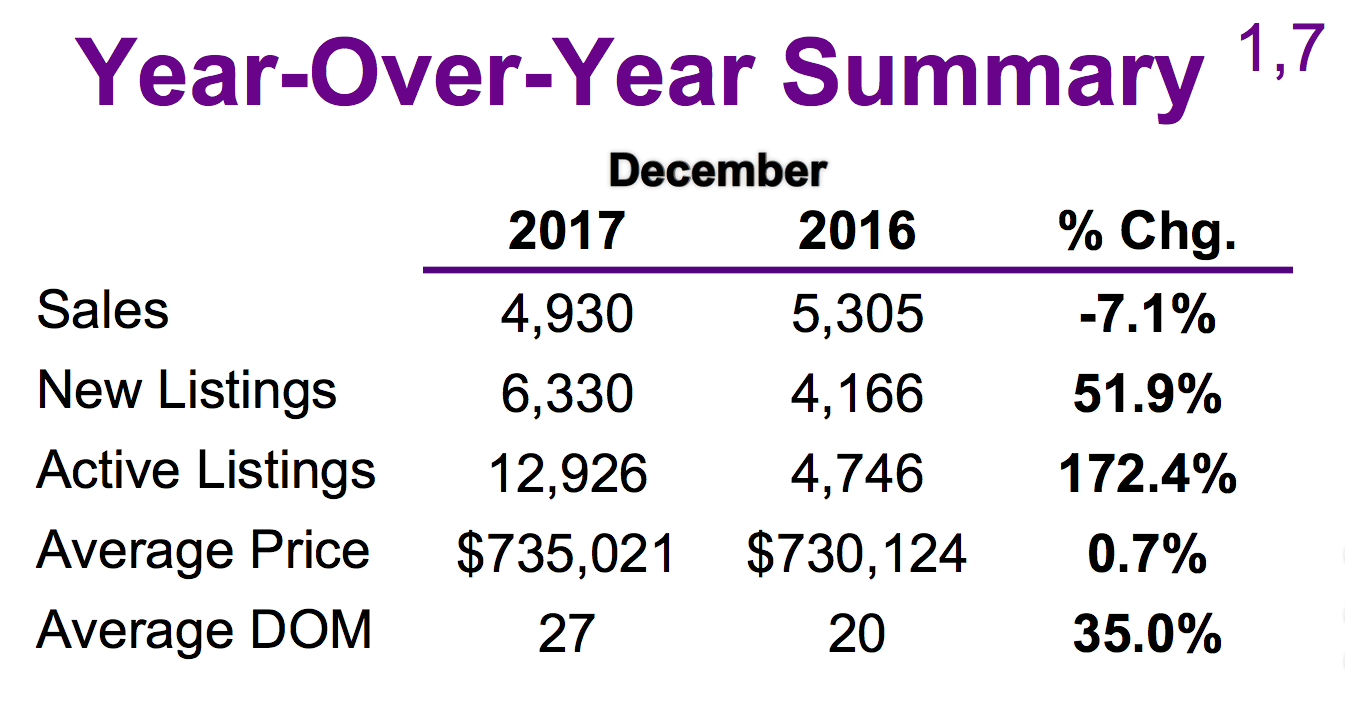
Just for perspective, Forward Inventory…meaning how many months of “supply” are available based on the number of sales versus the Total Active Listings…stood at 2.62 months in December. Prior December figures were:
- 2016: 4,746 Active Listings / 5,338 Total Sales = .89 [e.g. less than a month]
- 2015: 9,137 Active Listings / 4,945 Total Sales = 1.85 months
- 2012: 13,241 Active Listings / 3,690 Sales = 3.6 months
- 2007: 13,452 Active Listings / 4,646 Sales = 2.9 months
- 1997: 15,448 Active Listings / 3,017 Sales = 5.12 months
So, December ’17’s Forward Inventory looks pretty average when given a little context. The questions, obviously, revolve around whether or not that trend continues, and - if so - for how long and to what degree.
Incidentally, the headline of that December, 1997 MarketWatch report was “Best year for the decade!”. “Decade” meaning the 1990’s which represented a multi-year recovery from the severe 1989 residential market “correction”.
Looking at some specific numbers from the December ’17 report…
Sales of Detached homes in Metro Toronto totalled 454 units in December, down 13.4%, at an average sale price of $1,250,235, down 2.8%. In the balance of the Greater Toronto area, 1484 detached homes changed hands, off 13.7%, at an average price of $910,216, a 2.4% drop. Again, those are year-over-year figures: It should be noted that Detached homes in Metro Toronto fell about 20.8% - or $328,000 - from their peak in April 2017. Detached homes in the balance of the GTA - “the 905" - have fallen about19% from their peak which occurred in March, 2017 - a drop of about $214,000. Pretty heavy for eight or nine months.
Overall Average Home Price Still Up in '17
The TREB report notes that the overall average selling price for all of 2017 versus 2016 was up 12.7% to $822,681 including all areas and home types - reflective, obviously, of the incredible run-up in prices in the first three or four months of 2017.
The overall average price for December - including all property types and all TREB areas - actually rose 0.7%. That increase came largely on the back of the Condominium Apartment sector, the overall average price for which was 14.4% higher.… Even though the number of condo apartment sales has been falling [significantly] since April. December sales of Metro Toronto Condo Apartments in December were down 8.8% at an average sale price of $532,700 up 14.1%. In the balance of the GTA, 437 changed hands, down 11.4%, an average sale price of $430,001, up 14.5%. If the sales numbers continue to fall, prices will likely follow.
With that continued spike in inventory and lower sales numbers, buyers are breathing a little easier and taking the time for home inspection conditions and the like: Homes took "35% longer to sell" this December versus last at 27 days on the market compared to 20.
TREB President Tim Syrianos in the report: “Much of the sales volatility in 2017 was brought about by government policy decisions. Research from TREB, the provincial government and Statistics Canada showed that foreign home buying was not a major driver of sales in the GTA. However, the Ontario Fair Housing Plan, which included a foreign buyer tax, had a marked psychological impact on the marketplace. Looking forward, government policy could continue to influence consumer behavior in 2018, as changes to federal mortgage lending guidelines come into effect.”
And, from TREB’s Director of Market Analysis, Jason Mercer: “It is interesting to note that home price growth in the second half of 2017 differed substantially depending on market segment. The detached market segment – the most expensive on average – experienced the slowest pace of growth as many buyers looked to less expensive options. Conversely, the condominium apartment segment experienced double-digit growth, as condos accounted for a growing share of transactions.”
Set Up Your Own Customized SmartSearch
What's your property worth today?
JustBungalows.com Home Page
Questions? Comments? ...We'd ![]() to hear from you!
to hear from you!
Browse GTA Bungalows by City / Region:
Durham Region | Halton Region | Peel Region | Simcoe County | Toronto by Boroughs | York Region
Browse "Beyond the GTA" Bungalows by City / Region:
Brant & Brantford Township | Dufferin County | Grey County | Guelph & Wellington County | Haldimand County | Haliburton County | Hamilton [City] | Hastings County | Kawartha Lakes | Kitchener-Waterloo & Cambridge | Muskoka District | Niagara Region | Northumberland County | Parry Sound District | Peterborough City & County | Prince Edward County

