Greater Toronto, Ontario - Friday May 3, 2024 - The President of the Toronto Regional Real Estate Board [TRREB], Jennifer Pearce, this morning released the residential MLS® sales statistical summary for April, 2024, via the Board’s monthly “MarketWatch” publication. Here’s the bottom line: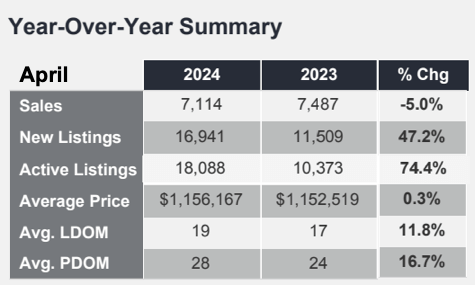 Sales volume a little softer; Selling prices flat; Inventory jumps big-time.
Overall…
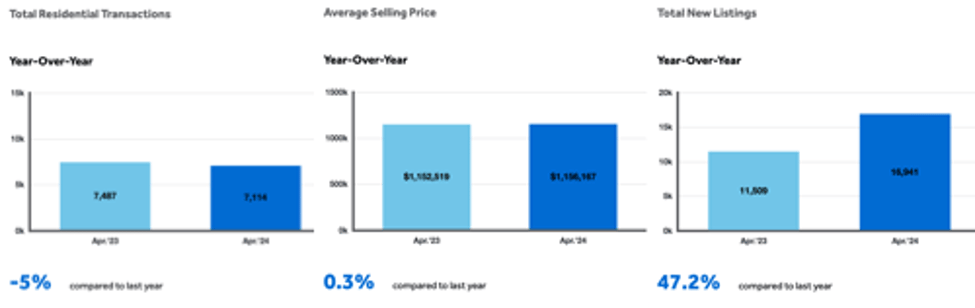
…meaning all home types & classes across all of TRREB’s geographical market area - the average selling price came in at $1,156,167 which was all but unchanged from last April at “+0.3%”.
Total volume on the month was 7,114 MLS® home sales reported. That was down an even five percent.
Due to the seasonality of the residential real estate market, figures quoted here are year-over-year [“YoY”] comparisons unless specifically noted otherwise.
Specific Numbers by Home Type
There were 750 sales of Detached homes in Metropolitan Toronto, down 1.2%, at an average sale price of $1,822,244, a modest increase of 2.2%. In the balance of the GTA - “The 905” [area code], generally speaking - there were 2,425 sales of Detached homes, down 9%, at an average of $1,421,377, a slim increase of 1.2%.
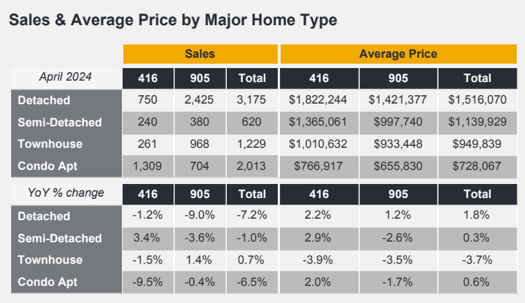 The Condo Apartment sales figures were also mixed with a total of 1,309 units sold in Metro T.O., down 9.5%, averaging $766,917, up an even two percent. In the rest of the market area there were 704 sales recorded in April, all but unchanged at “-0.4%”, and averaging $655,830, off 1.7%.
Within that freehold homes [e.g. non-Condo] group, Bungalows in Toronto and The GTA continue to be a very popular option - particularly for empty nesters / “Matures” looking to downsize - but, in the bigger picture, they’re also attractive to buyers such as young families thinking of trading Condo Apartment balconies for back yards. Investors tend to like Bungalows as well because they’re often conducive to “reno & flip” for a better profit margin, and to longer-term investors who want to convert basements to rental units: These single storey homes usually have easier access to the lower level from the exterior of the house as opposed to two-storey homes which tend to have centre-hall plans with staircases to the lower level that are not easily accessed from the outside of the house.
Quotable…
TRREB Chief Market Analyst Jason Mercer:
“Generally speaking, buyers are benefitting from ample choice in the GTA resale market in April. As a result, there was little movement in selling prices compared to last year. Looking forward, the expectation is that lower borrowing costs will prompt tighter market conditions in the months to come, which will result in renewed price growth, especially as we move into 2025.”
TRREB CEO John DiMichele:
“All levels of government have announced plans and stated that they are committed to improving affordability and choice for residents. However, more work is needed on alignment to achieve these goals, whether we’re talking about bringing enough housing online to account for future population growth or finding the right balance between government spending and combating inflation. We can’t have policies in opposition. Housing policy alignment is key to achieving sustained, tangible results.”
TRREB President Jennifer Pearce:
“Listings were up markedly in April in comparison to last year and last month. Many homeowners are anticipating an increase in demand for ownership housing as we move through the spring. While sales are expected to pick up, many would-be home buyers are likely waiting for the Bank of Canada to actually begin cutting its policy rate before purchasing a home.”
The Inventory Picture
Well, it’s been a long time coming, but there’s welcome news for home buyers in the report. While interest rates have still not been cut by the central banks - either here or south of the border - home prices will likely come under some pressure with the current build in inventory.
It’s very common to see the number of homes available for sale increase in the Spring, of course. What’s less common is the lacklustre accompanying sales volume increase. We’re also hearing a good amount of chatter around increasing instances of financial distress. Those things should combine to favour buyers - at least for the immediate future. It might also finally lay to rest the loud calls of “housing available for sale shortage & crisis” [as opposed to an affordability crisis].
Total Active Listings came to 18,088 as of month-end. That translates to a 74.4% spike versus last April at which time we also had softer sales volume YoY, but that came alongside a 21% drop in inventory. “New Listings” - which include homes “re-listed” - often coincident with a price change [reduction… or “improvement” in the latest vernacular] - totalled 16,941, a 47.2% jump.
“Forward Inventory” simply provides us with a “snapshot” of the number of homes for sale in the context of sales volume. In other words, “How long would it take for all the homes on the market to sell assuming a consistent volume of sales?”. Calculated as Total Active Listings over the Total Sales volume we get a little more than two-and-one-half months of available inventory. We were at about half that “relative inventory” a year ago.
Homes were selling “11.8% slower” this April at 19 Days on Market compared to 17 days a year ago. That’s the “Listing Days on Market” [LDOM] number which represents the average Days to Sell under the listing contract that’s in effect when the home actually sells. Property Days on Market [PDOM] represents the number of days the property was on market regardless of whether it was listed more than once by the same brokerage. In other words, it’s actually a better indicator of how long homes are taking to sell… but it’s also “incomplete”: It doesn’t include time on the market in instances where a seller opts to relist with a different broker.
Thanks, as always, for reading. And, as always, get in touch anytime if you have real estate related need or questions...
Andrew.
Questions? Comments? ...We'd to hear from you! Drop us a line here!...
Set Up Your Own Customized SmartSearch
What's your property worth today?
JustBungalows.com Home Page
Browse GTA Bungalows by City / Region:
Durham Region | Halton Region | Peel Region | Simcoe County | Toronto by Boroughs | York Region
Browse "Beyond the GTA" Bungalows by City / Region:
Brant & Brantford Township | Dufferin County | Grey County | Guelph & Wellington County | Haldimand County | Haliburton County | Hamilton [City] | Hastings County | Kawartha Lakes | Kitchener-Waterloo & Cambridge | Muskoka District | Niagara Region | Northumberland County | Parry Sound District | Peterborough City & County | Prince Edward County

