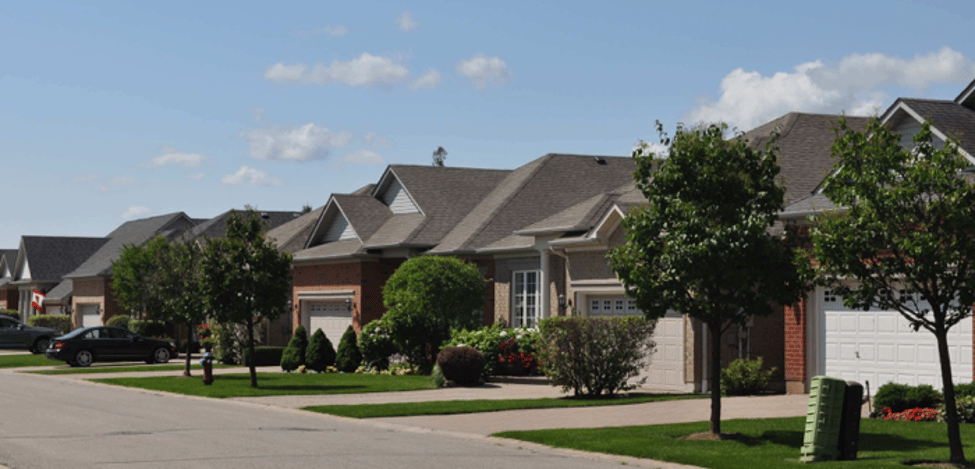
As 2023 disappears further into the rear-view and we focus forward on ‘24, we just wanted to take a step back and provide a snapshot of where the market is right now versus where it’s been over the past twelve to eighteen months - especially in the area of our favourite style of abode: Single storey houses - Bungalows, Raised Bungalows, and “BungaLofts” for sale & sold.
By the way - here’s a link to our “Bungalow-Specific” statistical update for January 2024. There’s also a full Archive of those updates on our JustBungalows main “QuickStats” page].
Some general observations on Single Storey numbers…
…for Bungalows / one storey homes and the variations thereof moving toward 2023 year-end and, just to be clear, references & stats here include BungaLofts which, it could be argued, aren’t really one storey. But they are becoming more popular… maybe we could call them “Bungalows Nouveau”?!...:
Southern Durham Region - which lies immediately east of Metro Toronto and includes, moving west-to-east, Pickering, Ajax, Whitby, Oshawa and Clarington - remained particularly strong with sales volume of Bungalows again hitting the 100 mark. The average selling price was a relatively reasonable $878,000 which, combined with its proximity to the mega-city and highways 401 & the 407 ETR [which is now extended all the way to Highway 115, south of Peterborough] makes it attractive to many buyers.
 That volume was slightly shy of the prior November’s 106 total; the average selling price was virtually unchanged versus last year’s $876,000.
Interestingly, “northern Durham” - including Uxbridge, Scugog and Brock - matched last year’s sales total of 18. The average Bungalow selling price of $1,250,328 eclipsed last year’s $952,194 on the back of a couple of particularly high-priced sales for that part of the Region. The median price for Bungalows sold there came in at $1,067,500 this November compared to $875,000 a year earlier.
The northern part of Simcoe County - due north of Toronto, generally, cooled somewhat at 89 Bungalows sold this November and 101 a year ago. Average selling price was $739,512 and $800,295 respectively. That includes the Towns & Communities north and west of the City of Barrie [but not Barrie itself] such as Clearview, Collingwood, Christian Island, Midland, Orillia, Oro-Medonte, Penetanguishene, Rama & Ramara, Severn, Springwater, Tay, Tiny, and Wasaga / Wasaga Beach. Phew. Big area. And that’s only part of Simcoe County…
 Southern Simcoe County - comprised of Adjala-Tosorontio, the City of Barrie, Essa, Innisfil, and New Tecumseth - totalled 67 Bungalow sales this November, well below the 90 of a year earlier. Average sale prices were $814,701 [Median $770,000] and $881,156 [Median $754,450] respectively.
Scarborough - Toronto’s “East end” - saw a virtually identical average selling price for Bungalows year-over-year at $994,613 this year and $993,439 last. Total sales volume was stronger this November at 84 versus 75.
Similar trend for the west end which includes - for TRREB’s “districts” - all of Etobicoke, and the westerly portions of North York and the City of York: last year’s 99 Bungalow sales faded to 77 this November, but average price there softened somewhat to $1,028,630 compared to $1,080,139.
Bungalows in the west end of the city have generally sold considerably higher than those in the east end, but that gap has closed quite a bit - probably because of higher demand for the more modest price point. Last November the gap was nearly $100,000 [though only $35,000 or so in terms of median price]. The gap in average price narrowed to about $34,000 last month [$17,000 for median]. We'll watch to see if that gap reverts if and when the market "normalizes".
Bungalow sales in York Region were significantly stronger this November at 93 compared to 81. Prices were pretty constant / flat on both the average and median fronts.
Peel Region had a bit of a different story at 52 sales on the month, down from 71 last November. Average and median prices were somewhat weaker as well at $1,133,442 & $985,000 respectively versus $1,212,297 & $1,080,000 twelve months earlier.
Rounding out the GTA, let’s take a quick peek at Halton Bungalows: stronger volume at 54 sales versus 48. Prices stumbled, though, at $1,114,339 [average] & $1,060,000 [median], down pretty significantly from $1,325,835 & $1,181,250 respectively - a drop of about $200,000+ in the average sale price.
Bigger picture…
…“peak home price” in Toronto and the Greater Toronto Area came - give or take, depending on area - in February, 2022 when it averaged $1.33 million overall [all home Types & Styles across all of TRREB’s market area]. As of December 2023 that overall average was $1.08 million. While the market’s ebbed & flowed somewhat erratically during that period, there’s no denying that the combined impact of higher interest rates and - very simply - an unsustainable run-up in prices - has put a semi-natural damper on the residential real estate market not only here in TRREB’s backyard, but across much of the country as well.
Here’s a “bullet point summary”...
…of Bungalow prices in a handful of “random” areas around south-central Ontario - just for some examples of what’s happened in that specific sector of the market - from November, 2023 & February, 2022 [‘23-11 - $ Average / # sold; ‘22-02 - $ Average / # sold]. You can also compare detailed Bungalow statistics -  including median sale prices - in other areas you might be interested in from that main QuickStats page if you don't see what you're looking for here:
Niagara Region: $656,496 / 85; $900,281 / 160
Peterborough City & County: $651,590 / 61; $968,296 / 69
Prince Edward County: $878,562 / 14; $1,587,500 / 6
Hamilton [City of]: $835,749 / 85; $1,029,264 / 126
Waterloo Region & Kitchener-Waterloo: $840,018 / 51; $1,105,549 / 62
Northumberland County: $794,420 / 46; $869,550 / 73
How about a more specific benchmark…
…for a clearer picture of what that segment of market’s done since Q1 2022 - that “peak price” point in time? Here’s a “random sampling”, this one of some Cities, Areas & Towns using TRREB MLS® Solds reported by “Sold Entry Date” for Freehold, Detached Bungalows with 2-or-3 bedrooms, 2 washrooms, and a 1-to-2 car garage. We’ve broadened the date range to![Map-Etobicoke “W08” [Etobicoke-Islington-City Centre West] Bungalows](https://photos.alphotoscdn.com/file/al-cms/MediaLibrary/15004/7e7f51d9-23ba-4dcb-9997-9830beaaf25c.png) include full quarters because the resultant sampling might otherwise be a little small for comparison with the more specific criteria. The figures below are for Q4 2023 [October, November, and December] and for Q1 2022 [January, February & March [expressed as ‘23-Q4 $ Average [# sold] vs ‘22-Q1 $ Average [# sold]:
include full quarters because the resultant sampling might otherwise be a little small for comparison with the more specific criteria. The figures below are for Q4 2023 [October, November, and December] and for Q1 2022 [January, February & March [expressed as ‘23-Q4 $ Average [# sold] vs ‘22-Q1 $ Average [# sold]:
Newmarket: $945,714 [7] vs $1,305,871 [14]
Brampton: $896,781 [16] vs $1,286,247 [42]
Georgetown: $1,076,625 [8] vs $1,233,067 [15]
Clarington: $845,225 [24] vs $1,054,139 [33]
Burlington: $1,048,233 [24] vs $1,411,357 [42]
Etobicoke “W08” [Etobicoke-Islington/City Centre West]: $1,187,949 [29] vs $1,599,544 [30]
Toronto “E04” [Scarborough West/Central]: $1,016,559 [29] vs $1,315,159 [37]![Map-Toronto “E04” [Scarborough West-Central]](https://photos.alphotoscdn.com/file/al-cms/MediaLibrary/15004/1cdc9715-1749-415c-8711-2edc2e6f6061.png)
Toronto “E03” - East York: $1,058,858 [14] vs $1,351,293 [24]
Whitby: $897,417 [12] vs $1,183,271 [30]
Wasaga Beach: $677,222 [9] vs $884,742 [16]
Belleville: $535,671 [17] vs $687,363 [8]
Cambridge: $744,130 [23] vs $971,996 [31]
St. Catharines: $659,679 [23] vs $824,207 [43]
Lindsay: $627,742 [12] vs $817,873 [18]
Milton: $910,800 [5] vs $1,475,111 [9]
Bradford: $869,189 [9] vs $1,027,000 [12]
Guelph: $773,053 [18] vs $978,251 [27]
Aurora: $1,102,857 [7] vs $1,411,000 [12]
Orangeville: $717,629 [4] vs $1,044,515 [15]
Barrie: $748,419 [43] vs $962,130 [95]
Port Hope: $656,000 [3] vs $921,057 [11]
Drop a line anytime if you’d like an update on the current value of your home, Bungalow or otherwise. “No strings attached.”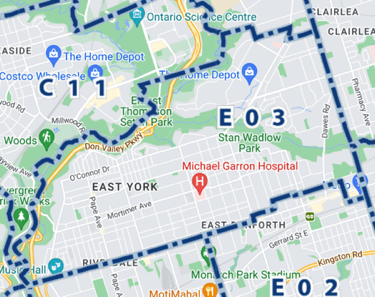 The market’s shifted a lot - and not very consistently across our market area geographically as you can see from the notes above.
Over the 20 years or so we’ve been “live” with the JustBungalows website [“The Original”... the very first of its kind as far as we’re aware!] we’ve built a very large database of folks in the area who’ve expressed interest in buying and/or selling Bungalows.
Whether you’re buying, selling, just starting to think about it, or sure you want to make a move but want more information regarding your “options”, that’s what we’re here for. Always a non-pressure, consultative experience when you make the choice to work with us - we're an experienced Group of professional, Full-Time Local Realtors®.
Questions? Comments? Drop us a line!…
Set Up Your Own Customized SmartSearch
What's your property worth today?
JustBungalows.com Home Page
Questions? Comments? ...We'd  to hear from you!
Browse GTA Bungalows by City / Region:
Durham Region | Halton Region | Peel Region | Simcoe County | Toronto by Boroughs | York Region
Browse "Beyond the GTA" Bungalows by City / Region:
Brant & Brantford Township | Dufferin County | Grey County | Guelph & Wellington County | Haldimand County | Haliburton County | Hamilton [City] | Hastings County | Kawartha Lakes | Kitchener-Waterloo & Cambridge | Muskoka District | Niagara Region | Northumberland County | Parry Sound District | Peterborough City & County | Prince Edward County
Note: Unofficial data. Copyright TRREB, theBB.group™ and JustBungalows.com™. TRREB MLS© data only. Figures may be rounded; dates may be expanded as noted. Year-over-year comparisons may require adjustment due to changing Board jurisdictional / data boundaries. For more information, please contact us. E&OE.

