Toronto, Ontario, March 5th, 2024 - The Toronto Regional Real Estate Board [TRREB], released its monthly MLS® stats update “MarketWatch'' this morning showing home prices in South-Central Ontario actually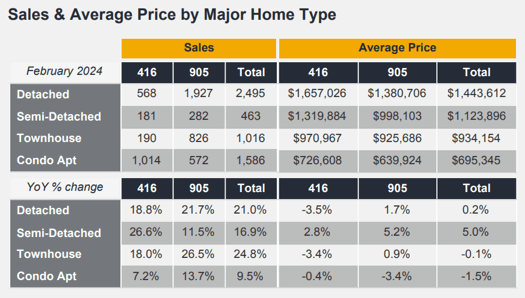 lost ground on a year-over-year [YoY], inflation-adjusted basis. With inflation, as measured by the CPI [Consumer Price Index… not to be confused with Concert Productions International], running at a hair under 3% and the average selling price up just 1.1%, prices were actually “net down” nearly two percent over the past year.
Interest rates are, again [or "still"], the talk of the town with speculation swirling about what Tiff M and the Bank of Canada might do at the next meeting, and kudos or criticism - depending on which side of the fence you’re on - over their “stand pat” position at the last meeting.
Canada Mortgage & Housing released a report a couple of months back that warned of a looming “renewal shock” on the mortgage front with higher rates leaving nearly 300,000 mortgage-holders in Canada squeezed financially with significantly higher monthlies in the first half of 2023 alone. Regardless of whether or not that eventually leads to any elevation in the volume of actual defaults, it certainly impacts the broader economy as households have less cash to spend on other things.
 In the first week of this year, however, Spring Financial posted an update showing that while some folks are definitely feeling the financial pinch of higher payments, actual mortgage defaults are still at record lows. But not so fast: “Defaults” are - obviously - that much further along the line as opposed to “Delinquencies”. The latter is, simply, “30 days late” on your payment - from the standpoint of when it’ll show up in your credit report, at least. And delinquencies have been increasing steadily since the beginning of last year. That post also notes that a record number of Canadians have been forced to resort to food banks and are behind on bills… though, obviously, trying to prioritize mortgage payments where possible in order to keep the roof over head.
The Canadian Bankers Association publishes updates on mortgage arrears statistics… “arrears” being defined by the CBA as “mortgages that have payments that are overdue for three or more months”. You can actually download the spreadsheet from their website [linked above], but what it shows is that over the past thirty years or so, arrears - as defined - peaked in 1996/1997 at around two-thirds of a percent of all mortgages outstanding with the “big banks” in Canada. That represented - at that time - 15,924 out of 2,466,705 mortgages in January of ‘97, for example. The average sale price of a home was, according to the local real estate board [“TREB”, at that time], about $212,000 on 4,979 sales. Interesting. The 5-year fixed mortgage rate was about 7.25%.
The latest stats available from that site are for December, 2023: 9,057 mortgages in “arrears” out of 5,041,510 total mortgages, or 0.18%. That’s pretty low from an historical standpoint, though definitely a significant uptick from the modern-day low of 0.14% in the Summer of 2022.
Meanwhile, even with the B of C electing to sit on its hands, some mortgage interest rates actually have trended downward with five-year fixed financing now available in the 4.6% to 5% range. That might take a bit of shopping around to find and, as always, pay attention to the other “terms” of your mortgage [e.g. prepayment privileges, portability mid-term, early termination penalties, and so on]. Drop us a line anytime if you want more info on questions to ask your mortgage people.
The Big Picture
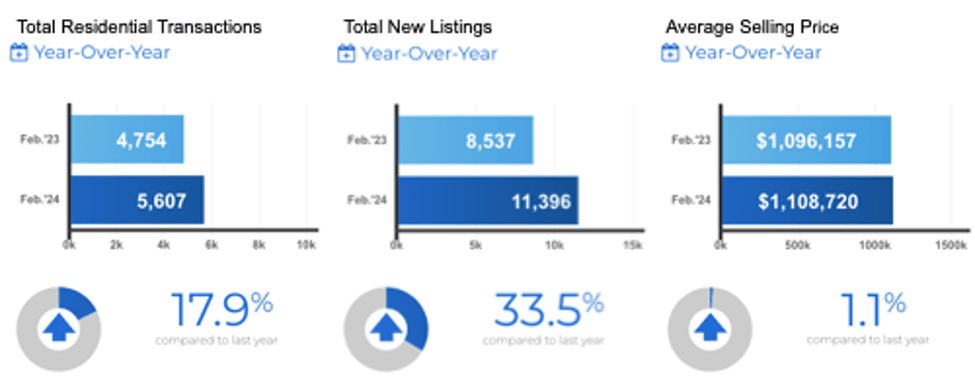
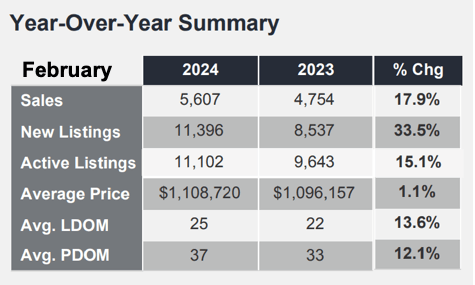
Overall - meaning all home types & all of TRREB’s geographic market area - 5,607 homes were reported sold last month by Member Realtors®, up 17.9% from last February’s “dumpster fire” of 4,754 [which represented a forty-seven percent “tank” from the prior February]. All figures quoted herein are year-over-year (YoY) comparisons unless specifically noted otherwise. As mentioned above, average home selling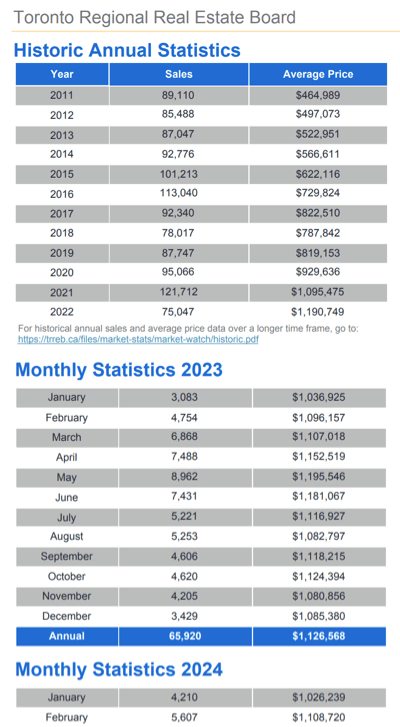 prices were pretty much “flat” at +1.1% to $1,108,720 compared to last February’s [adjusted] $1,096,157.
Once again, the number of homes available for sale rose - and along with it, the length of time it took to sell “the average home”. More detail below in the “Inventory” portion…
Specific Numbers
Within the Detached homes “group” 568 sales were reported in Metro Toronto, up a healthy 18.8%, at an average sell price of $1,657,026, down 3 ½%. The balance of TRREB’s market area - “The 905”, generally speaking - saw 1,927 residential transactions reported, up 21.7%, at an average of $1,380,706, up 1.7%.
Condominium Apartment sales volume was also up, though selling prices were not: In “T. O.”, 1,014 units were reported sold, up 7.2%, at an average of $726,608, all but unchanged at -0.4%. The rest of the GTA saw 572 Condo Apartments sell, up 13.7%, averaging $639,924, off 3.4%.
Looking back at those January, 1997 numbers noted above, there were more sales then than there were last month! That’s hard to believe - particularly in the context of there now being more than twice the number of mortgages outstanding now! Wow.
And remember February of 2022? Detached homes in “The 416” crossed the average two million dollar mark at $2,073,989 on 786 sales. [And while that sales volume was actually down 13.4% YoY, the price was “+23%” versus the prior February [2021] when our “byline” here was, “Hey…can ya spare a Bungalow?”! That sentiment still stands, by the way. In fact, a healthy percentage of the buyers who start out looking for a Bungalow to downsize to actually end up buying something like a Backsplit or a Sidesplit. A bit of a compromise given the stairs, but at least not the “full flights” like those in a 2-Storey home. In February of ‘21, just for the record, the home sales volume “overall” came in at 10,929. By the time we hit the prices noted above in February of ‘22, that volume total had come down to 9,097… which now looks pretty robust.
Quoting from the Report:
TRREB Chief Market Analyst Jason Mercer:
“As we move through 2024, an increasing number of buyers will re-enter the market with adjusted housing preferences to account for higher borrowing costs. In the second half of the year, lower interest rates will further boost demand for ownership housing. First-time buying activity will also be a contributing factor, as many renters look to trade high monthly rents for a long-term investment in which they can live and build equity.”
TRREB CEO John DiMichele:
“Population growth has been at a record pace and with the anticipated lower borrowing costs, the demand for housing – both ownership and rental – will also increase over the next two years. Unaffordable housing not only has a financial impact but also a social impact. Recent research conducted for TRREB by CANCEA in our 2024 Market Outlook and Year in Review report underscores the negative impact of unaffordable housing on peoples’ mental health and life satisfaction. It’s comforting to see that there has been some real building happening in the GTA and that the provincial government is rewarding those municipalities that are working to eliminate the red tape and meet those homeownership needs.”
Board President Jennifer Pearce:
“We have recently seen a resurgence in sales activity compared to last year. The market assumption is that the Bank of Canada has finished hiking rates. Consumers are now anticipating rate cuts in the near future. A growing number of homebuyers have also come to terms with elevated mortgage rates over the past two years. To minimize higher monthly payments, some buyers have likely saved up a larger down payment, chosen to purchase a less-expensive home type and/or looked to a different location in the GTA.”
On Inventory…
Total Active Listings - a much more “relevant” figure than “New Listings” as we’ve discussed here many times before - came in at 11,102 as of month-end. That’s a 15.1% jump from last February. [Speaking of Feb ‘22, by the way!... that TAL number was 6,985… and that represented a twenty percent inventory squeeze / haircut from Feb ‘21. Can you say, “FOMO”?]
“Forward Inventory” gives us an idea of how much time it’ll take to sell all the properties on the market given a constant rate of sales (calculated as Total Active Listings / current month’s Sales): That’s a hair under two months of inventory available. 1.98 months to be exact. And while inventory’s up from a year earlier, that’s still actually pretty snug by historical standards.
Homes took “13.6% longer” to sell this February at 25 days on the market (DoM) versus last February’s average of 22 days. The “broader” PDOM - Property Days on Market [which takes into account some of the prior listing time where a home was re-listed with the same Brokerage - came in at 37 days, up from 33 days.
As Jed & his kin put it, “...like to thank you folks for kindly droppin’ in…”. Enjoy the mild weather. Green shoots coming soon! 🌱 🌞😎🪴🌳 Y’all come back now…..
Andrew.
Questions? Comments? Drop us a line!…
Set Up Your Own Customized SmartSearch
What's your property worth today?
JustBungalows.com Home Page
Questions? Comments? ...We'd  to hear from you!
Browse GTA Bungalows by City / Region:
Durham Region | Halton Region | Peel Region | Simcoe County | Toronto by Boroughs | York Region
Browse "Beyond the GTA" Bungalows by City / Region:
Brant & Brantford Township | Dufferin County | Grey County | Guelph & Wellington County | Haldimand County | Haliburton County | Hamilton [City] | Hastings County | Kawartha Lakes | Kitchener-Waterloo & Cambridge | Muskoka District | Niagara Region | Northumberland County | Parry Sound District | Peterborough City & County | Prince Edward County

