Greater Toronto, Ontario, March 5th, 2025 - The Toronto Regional Real Estate Board - “TRREB” - today released its statistical update, “MarketWatch”, for February this morning. It was not what you might call “stellar”, but it is what you might expect: lower sales volume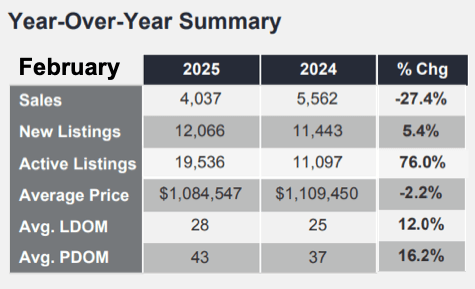 and rising inventory. In short, a full-blown shift to a Buyer’s Market.
Granted, that shift was already under way or - it could be argued - already complete… but with affordability an issue for a while now combined with the intense, high-stakes threats + waffling & flopping around like a fish out of water spewing from Washington, D.C. [or a personal oceanside resort complete with private golf course in Palm Beach, Florida depending on whether or not the president actually needs to be in the capital], there’s no question the pendulum has swung. Hard.
One more factor might be the fact that we’re being told it’s likely interest rates will continue to fall. That on its own can have buyers stick to the sidelines waiting for better buying conditions from a borrowing standpoint. In any event, it’s been a long wait for would-be buyers to hear news in their favour on the home price and carrying costs front. Unfortunately for all the price tag is extremely high. A proverbial “double-edged sword”.
The Big Picture
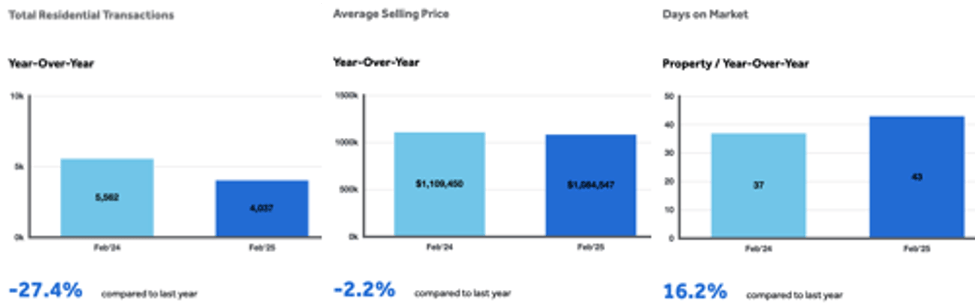
Including all home types & styles across all of the geographic area serviced by TRREB member Realtors®, total sales volume in February was 4,037 homes. February 2024 saw 5,562 homes go under “firm” sale contract. That’s a decline in sales volume of 27.4%. And February 2024 wasn’t exactly what you might call a “Banner Year”.
 The overall sale price of those homes this February was $1,084,547. Pretty stable under the circumstances at -2.2%... though that appears to have been largely on the back of a rise in the average price of Detached homes in Toronto proper. More on that below.
All figures reported here are year-over-year (YoY) comparisons except where specifically noted otherwise.
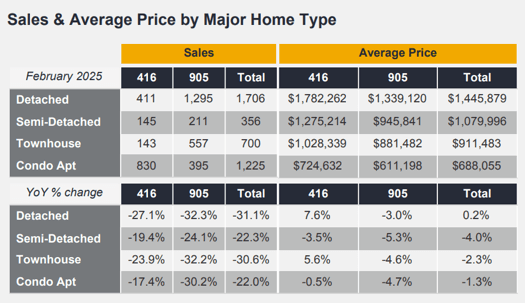
Specific Numbers by Major Home Type
Sales volume of Detached homes in Metro Toronto totalled 411 units, down 27.1%, averaging a selling price of $1,782,262, UP 7.6%🤷♂️. The balance of TRREB’s market area - “The 905” [area code] generally speaking - there were 1,295 Detached sales reported, down 32.3%, at an average of $1,339,120, off an even three percent.
Condo Apartment sales - already struggling of late - were down 17.4% in Metro T.O. to 830 reported averaging $724,632, also “relatively strong under the circumstances” at -0.5%. The balance of the market area saw 395 units sell, down 30.2%, averaging $611,198, off 4.7%.
Quotable… From the Report:
TRREB Chief Market Analyst Jason Mercer:
“On top of lingering affordability concerns, home buyers have arguably become less confident in the economy. Uncertainty about our trade relationship with the United States has likely prompted some households to take a wait and see attitude towards buying a home. If trade uncertainty is alleviated and borrowing costs continue to trend lower, we could see much stronger home sales activity in the second half of this year.”
TRREB CEO John DiMichele:
"With the Ontario provincial election just behind us and the federal political situation in flux, there is a lot to consider from a policy perspective when it comes to housing. Not only do existing policy makers and those vying for high public office need to make clear their direction on housing supply and affordability, but they also need to be clear on how they intend to tackle issues related to trade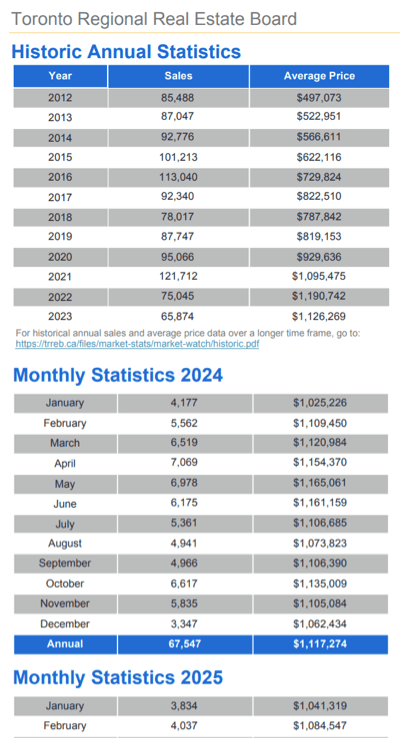 and the economy. Clear direction will go a long way to strengthen consumer confidence.”
TRREB President Elechia Barry-Sproule:
"Many households in the GTA are eager to purchase a home, but current mortgage rates make it difficult for the average household income to comfortably cover monthly payments on a typical property. Fortunately, we anticipate a decline in borrowing costs in the coming months, which should improve affordability.”
Thank-you, Ms. Barry-Sproule.
On Inventory…
New Listings. New Listings. New Listings. Everyone talks “New Listings.” That may be the inventory stat that talks loudest, but clearly that’s not the inventory stat that talks… well… most clearly. New Listings - properties newly listed in February - totalled 12,066. That was up 5.4%. The problem with that Stat - again - is that it includes properties that were already listed. Meaning they’re not really “new” at all.
For various reasons home sellers and their agents decide to terminate a listing and “re-list” it - often with a price “adjustment”. Read, “drop”. Or - particularly in markets like the present one - listing contracts simply expire without the home selling. Happens all the time… unless inventory’s at historic lows. The problem with the “New” stat is that it includes all those “re-tread” listings.
For those reasons - as we’ve been saying for years - the “tell” comes in the Total Active Listings [TAL] statistic. New listings - as noted above - were up a modest 5.4%. TAL were up seventy-six percent. Can you say, “Buyer’s Market”?! 19,536 homes for sale versus 11,097 a year ago. Bear in mind that Condo Apartments do make up more than their fair share of those listings… still - housing crisis? No. Affordability crisis compounded by wavering consumer confidence? Yeah. And then some.
“Forward Inventory” gives us an idea of how long - given a constant level of sales volume - it would take to sell all the homes currently listed for sale (Total Active Listings / monthly Sales): That comes to 4.84 months. Historical averages for Forward Inventory - a “healthy, balanced market” - are in the 60-90 day range. #BuyersMarket
What we are sure of is that Bungalows continue to enjoy a larger amount of activity across TRREB’s market area [“...and Beyond!...”] Region as folks downsize without trading their back yards for balconies - yet - and most often take some tax-free dollars off the table to pad retirement accounts, help out the kids, and so on. Inventory levels of single storey homes continue to be relatively tight - especially in the more “mainstream” price points and popular Towns & Neighbourhoods - for those reasons. It doesn’t help that many builders in recent decades have built fewer Bungalows & Bungalofts. That’s because, of course, they can get more money for more square footage… and that, of course, implies two-storey builds the vast majority of the time.
Each month we post a "QuickStats" update specifically covering Bungalows for sale and sold in TRREB's market area of South-Central Ontario. That's like a "summary" with links to our monthly updates going back more than five years. Last month's update is here. We also track active and sold listings on an "informal", weekly basis - simply to monitor the state of the market - #SOTM - purely from the standpoint of available listings versus sales volume. Looking at the "Bungalow QuickStats" linked above versus the overall market activity it's interesting to note that Bungalows and other "versions" of Single Storey low-rise homes are still very much in demand - for obvious reasons. If it's of interest to you, compare that February post with the July 2024 QuickStats post for example.
As for pure sales volume versus available inventory, on July 1st, 2024 there were 9,899 Bungalows for sale on TRREB. Remember, these are "unofficial" figures. There was a grand total of 47,070 homes for sale of all types & styles - including the Bungalows. The latter, then, represent about twenty-one percent of the market's inventory. Firm sales of Bungalows - or "going under contract" as some put it - totalled 591 in the prior seven days, and total sales came in at 2,496 for the prior seven days. That means single storey homes accounted for nearly 24% of the sales despite the lower piece they occupy in overall inventory.
Those figures - just for the record - for the seven days ending March 2, 2025 were 9,371 Bungalows for sale of 46,595 total homes for sale across the market area, or about 20% of inventory consisted of "1 storeys". For that same seven days, 530 Bungalows went under contract out of 2,451 total firm sales, or about 21.5% of the market. The other take-away from those numbers is the bigger picture inventory: There are a lot fewer Bungalows for sale right now than there were during the Dog Days of Summer, 2024 than there are now on the cusp of the Spring Market... which may come to be known as "The Spring Market that Wasn't" the way things are going. 🤞 Let's hope not. There are also fewer overall homes for sale in The GTA & South-Central Ontario now than there were last summer. #Limbo ...??
Homes took 28 days to sell [DoM - Days on Market] on average in February. That was “12% slower” than the year-earlier period. No shock there given the inventory numbers, etcetera...
Thanks - as always - for reading. Do your best to ignore the intense “noise” right now… as difficult as that is. [BTW - it occurs to me that this could possibly give birth to a new addition to the dictionary, namely “Elongate”. #Elongate ??! Capital “E”. 🤷♂️ Never mind...]
Anyway - let’s focus on “opportunity coming from adversity”. It won’t necessarily be easy, but opportunity will surely be there.If there’s anything we can do to help in the area of real estate, financing, and “related” - even if that’s just an informal conversation - feel free to drop a line: That’s what we’re here for. Spring is poised…
Andrew.
#JustBungalows
#theBB.group
Questions? Comments? ...We'd ❤️ to hear from you: Drop us a line here!...
Set Up Your Own Customized SmartSearch
What's your property worth today?
Browse GTA Bungalows by City / Region
Durham Region | Halton Region | Peel Region | Simcoe County |
Toronto by Boroughs | Toronto by Neighbourhoods | York Region
Browse "Beyond the GTA" Bungalows by City / Region
Brant & Brantford Township | Dufferin County | Grey County | Guelph & Wellington County | Haldimand County | Haliburton County | Hamilton [City] | Hastings County | Kawartha Lakes | Kitchener-Waterloo & Cambridge | Muskoka District | Niagara Region | Northumberland County | Parry Sound District | Peterborough City & County | Prince Edward County

