Greater Toronto, Ontario - Tuesday, February 6th, 2024 – The President of the Toronto Regional Real Estate Board [TRREB], Jennifer Pearce, today released the Board’s monthly “MarketWatch” MLS® sales stats update showing a relatively robust start to the year in terms of sales volume. Total Active Listings [“Inventory”, in a word] was also up, though not as much as we’ve been seeing in recent months. Prices were generally flat overall.
Figures herein are presented as year-over-year comparisons unless specifically noted otherwise.
Overall…
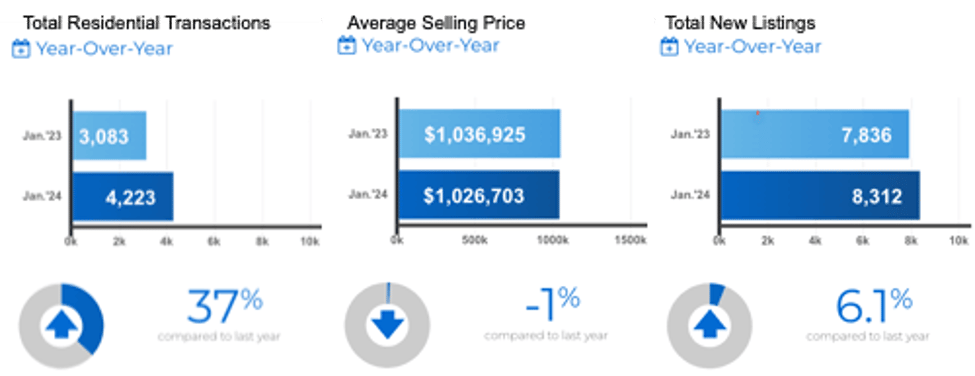
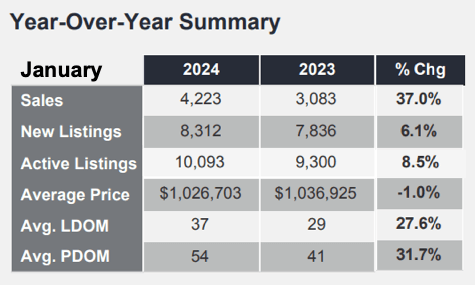
Total overall sales volume including all of TRREB‘s market area and all home types came in at 4,223 for the month. That’s a 37% jump over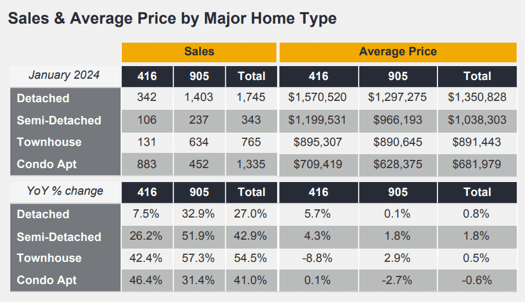 last January. This January’s overall average selling price was $1,026,703, down one percent from $1,036,925 [adjusted].
Prices have, of course, been positively influenced to the extreme by low inventory and ultra-low interest rates up until the Bank of Canada’s aggressive inflation fight. While inventory, expressed most accurately by the “Total Active Listings” [TAL] stat, has been increasing significantly over recent months, January’s YoY rise of 8.5% - while a lesser pace than recent months - still brings some relief in the form of choice for folks on the buyer side. It also helps to free up the “gridlock” we’ve been seeing as people who actually want to sell and move have hesitated out of fear of not being able to find a suitable home. This appears to be particularly the case in the Bungalow / One Storey homes market as many of those who’d like to move on are the “Matures” & Empty Nesters - largely the Baby Boomer cohort - but are hesitant in a tight-inventory situation.
 Specific Numbers by Major Home Type
Sales volume of Detached homes rose 7.5% in Metro Toronto to 342 units at an average sale price of $1,570,520, up 5.7%. The balance of TRREB’s market area - “The 905“ area code, generally - including the balance of the GTA and now much of South-Central Ontario - saw 1,403 “Detacheds” sell “firm”, strongly eclipsing the Toronto sales volume increase at +32.9%. The average selling price for that broader geographic area was $1,297,275, all but unchanged YoY [+0.1%]. Interesting…
The Condo Apartment market was also very strong in terms of sales volume… but not so much on the price front: 883 units sold in Metro T.O., up 46.4%, at an average of $709,419 which was another “+0.1%” print. In the rest of the area 452 units sold, up 31.4%, averaging $628,375, down 2.7%.
If it’s of interest to you, here’s a post we just did looking specifically at the Bungalow / single storey home market across The GTA & South-Central Ontario “then & now”. It also includes some comparisons of how the one storey home segment has performed and what prices have done since the broader market “peak” early in 2022 using a sampling of “Freehold, Detached Bungalows with 2-or-3 bedrooms, 2 washrooms, and a 1-to-2 car garage” sales in the fourth quarter of 2023 versus the first quarter of 2022.
Quoting from the report:
TRREB CEO John DiMichele:
“While housing market conditions are expected to improve with lower borrowing costs, there are still a number of policy issues that need to be addressed. At the federal level, more reflection on the Office of the Superintendent of Financial Institution (OSFI) mortgage stress test is required, especially to its application at different points in the interest rate cycle. The focus for the Province needs to remain on building 1.5 million new homes. At the municipal level, raising property taxes without consistent support from the federal and provincial governments won’t eliminate Toronto’s structural deficit. Helping first-time homebuyers get into the ownership market will ease movement across the entire spectrum and relieve pressure on the rental market.”
Board President Jennifer Pearce:
“We had a positive start to 2024. The Bank of Canada expects the rate of inflation to recede as we move through the year. This would support lower interest rates which would bolster home buyers' confidence to move back into the market. First-time buyers currently facing high average rents would benefit from lower mortgage rates, making the move to homeownership more affordable.”
Board Chief Market Analyst Jason Mercer:
“Once the Bank of Canada actually starts cutting its policy rate, likely in the second half of 2024, expect home sales to pick up even further. There will be more competition between buyers in 2024 as demand picks up and the supply of listings remains constrained. The end result will be upward pressure on selling prices over the next two years.”
That Inventory Thing
Total Active Listings were up as of month-end as noted above. The total number of homes listed for sale was 10,093. That’s a healthy increase of 8.5% [9,300 last January; adjusted]... still on the low side by historical standards, but healthy enough to keep some balance in the marketplace based on that Sales Volume outlines above and in more detail in the accompanying charts.
The number of homes “Newly Listed” on the month was 8,312, up 6.1%.
“Forward Inventory” gives us an idea of how long it would take to sell all the homes currently listed assuming the RATE of sales [“volume”] stayed constant. It’s calculated by simply dividing that TAL figure by the number of homes that sold on the month. That equals about 2.4 months. Still a bit snug by - again - “histprical standards”, but much better than we’ve seen over the past several years.
“Absorption Rate” represents the rate at which the market “absorbs” the newly listed homes in the form of actual sales. It’s calculated by dividing the month’s sales volume figure by the “New Listings”. That came to .501 for January.
Homes sold “27.6% slower” at 37 “Listing Days on Market” [LDOM] compared to 29 a year earlier. “Property Days on Market” [PDOM] was 54 days this year versus 41 last.
A note on “LDOM” versus “PDOM”... Listing Days on Market is the average number of days homes were on the market before they sold firm. Property Days on Market refers to the average number of days to sell irrespective of whether the property was listed more than once by the same combination of seller and brokerage during the original MLS® listing contract.
For a history of “Bungalow-specific” statistics - including sales volume, average & median prices, property taxes and more - broken down by Toronto, GTA, and South-Central Ontario Cities, Regions & Towns, please click here.
As always, we appreciate you being here; hope the info is useful and easily “digestible”! Enjoy this relatively mild winter weather; before we know it “Spring will spring”... just not quite yet.
Andrew and theBB.group
Questions? Comments? Drop us a line!…
Set Up Your Own Customized SmartSearch
What's your property worth today?
JustBungalows.com Home Page
Questions? Comments? ...We'd  to hear from you!
Browse GTA Bungalows by City / Region:
Durham Region | Halton Region | Peel Region | Simcoe County | Toronto by Boroughs | York Region
Browse "Beyond the GTA" Bungalows by City / Region:
Brant & Brantford Township | Dufferin County | Grey County | Guelph & Wellington County | Haldimand County | Haliburton County | Hamilton [City] | Hastings County | Kawartha Lakes | Kitchener-Waterloo & Cambridge | Muskoka District | Niagara Region | Northumberland County | Parry Sound District | Peterborough City & County | Prince Edward County

