
Toronto, Ontario, February 4, 2026 - Member Realtors® and the Toronto Regional Real Estate Board - which covers Metropolitan Toronto, The GTA, The Greater Golden Horseshoe and some other peripheral bits & pieces of Southern Ontario - this morning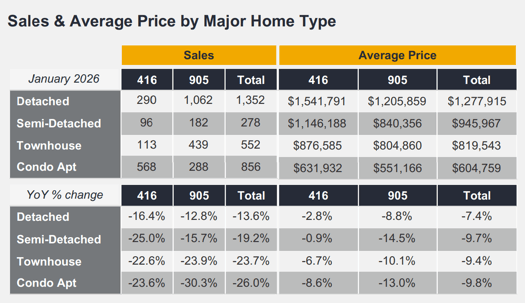 released their monthly residential MarketWatch report briefing MLS® active listings & home sales activity for the month of January, 2026. Let’s just say this: The year isn’t exactly off to a roaring start.
That should come as a surprise to precisely nobody (nobody that's paying attention, at least), given tariffs, trade questions, resultant job security concerns... not to mention the "hangover" of still-high prices that many would-be first-time buyers simply cannot afford. Granted - home prices have come off the peak - generally regarded as February / March 2022 - but still… a million bucks? Until prices stabilize at the very least, expect buyers to sit on their hands. If you think something’s going to be cheaper tomorrow, you’re not likely buying it today. Exceptions to every rule, yes… but it’s - clearly - a huge commitment.
Overall…
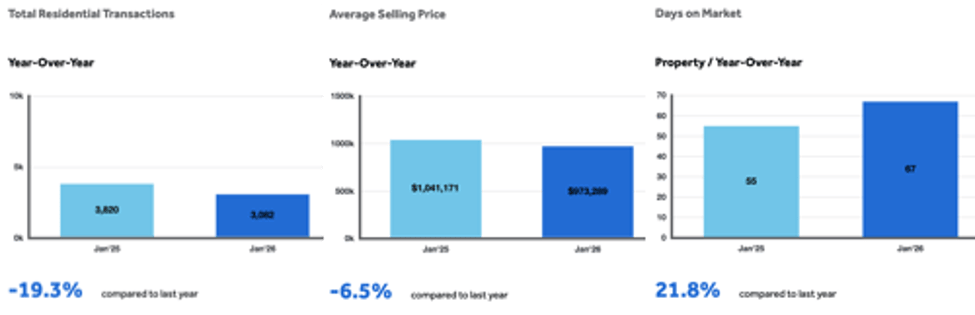
…including all home Classes (e.g. Freehold, Condominium, Land Lease…), Types (e.g. Detached, Attached, Semi-Detached, 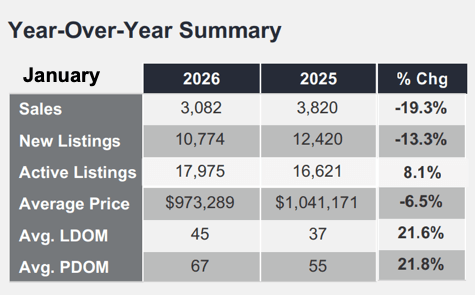 Apartments…) and Styles (e.g. Bungalow, 2 Storey, Split Level, BungaLoft…) across all of the local Board’s market area, January's average selling price came in at $973,289 - a decrease of 6½ % Compared to January 2025. All figures herein are year-over-year [YoY] comparisons, unless otherwise noted.
3,082 home sales were reported through TRREB’s MLS® System on the month - down 19.3% YoY.
Some Specific Numbers
Detached home sales in Metro Toronto - “The 416” - were off 16.4% to 290 homes averaging a selling price of $1,541,791 - off “only” 2.8%. In “The 905” area code - The GTA, surrounding Metropolitan Toronto generally - Detached home sales totalled 1,062, down 12.8%, at an average of $1,205,859, down 8.8%.
Condo Apartment sales - which have already struggled significantly over the past 12+ months - absolutely tanked in January. In “The Big Smoke”, 568 units went under “firm sale contract”, down 23.6%, at an average $631,932, down 8.6%. The balance of the market area saw just 288 unit sales reported, off 30.3%, at an average of $551,166, off an even 13%.
For specific figures on Bungalows & 1 Storey Homes for sale & sold, check out our “Bungalow QuickStats” page which goes into a deeper dive on that “niche market”, complete with a map of Median Bungalow prices by Region / County / District. That info’s updated monthly.
Quoting… From the Report
Jason Mercer, TRREB Chief Information Officer:
Daniel Steinfeld, [new] Board President:
John DiMichele, Board CEO:
Typo? Naw. Omission? Nope. We've been posting these stats for a long, long time and this is the first time - to my recollection - that our fearless leaders have had zero to say. At least not that was posted in the report. Oversight? Unlikely. Hmmm...
On Inventory…
“Total Active Listings” - the “purest” number on listing inventory in our opinion, if less broadly quoted - were 17,975 as of month-end… up 8.1%. Homes “Newly listed” were down 13.3% - we put “Newly listed” in quotes since “new” ain’t always new: That stat includes properties previously listed & expired or were terminated… and subsequently re-listed - often with a “Price Improvement” (not from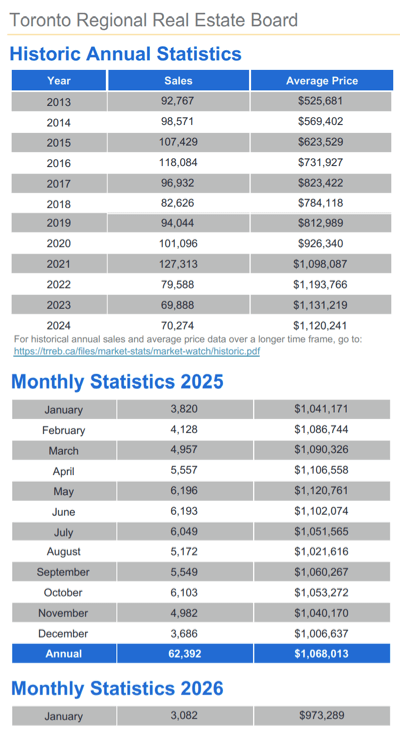 the Seller’s point of view), or simply “freshening up” the offering.
Forward Inventory (calculated simply as Total Active Listings / Sales Volume) came in at just under six months (5.83 to be exact) - definitely lots of homes available by historical - or any other - standards. What happened to that “housing shortage” everyone was up in arms about, anyway? Affordability crisis fueled largely by “FOMO” / fear of missing out? Definitely, in our opinion - as stated here many times. Will we need more homes built in the future? Of course. But now - no. And there go a bunch of jobs… Forward planning is everything - and - once again - it appears we’re not all that great at it.
Finally…
Homes took nearly 22% longer to sell this January versus last: 45 days on the market compared to 37. Bear in mind that's the “Listing Days on Market” (LDOM). “Property Days on Market” (PDOM) - which includes the time a home was on the market under a prior listing agreement(s) - but only includes the ones where such prior listing(s) were with the same broker - was significantly higher at 67 DoM. That's simply testament to the number of listings that are expiring or being terminated / re-listed and so on…
A little context? In February ‘22 - “The peak”, as noted & linked above - Average DoM was 9 days. NINE! The average sale price of a Detached in T.O. was $2,073,989… and 786 of ‘em sold that month.
Care for an update - including Sold info - specific to your own neighbourhood?... or another one that’s of interest?... Here’s a brief form to get that in motion (and - no - we don’t need your actual address).
As always, we appreciate your time & interest. May the winds of change blow gentle in ‘26… feels like we’ve already been through the wringer!
Andrew.
@JustBungalows @theBB.group
#JustBungalows #theBB.group
Questions? Comments? ...We'd ❤️ to hear from you: You can drop us a line here!...
Set Up Your Own Customized SmartSearch
What's your property worth today?
Browse GTA Bungalows by City / Region
Durham Region | Halton Region | Peel Region | Simcoe County |
Toronto by Boroughs | Toronto by Neighbourhoods | York Region
Browse "Beyond the GTA" Bungalows by City / Region
Brant & Brantford Township | Dufferin County | Grey County | Guelph & Wellington County | Haldimand County | Haliburton County | Hamilton [City] | Hastings County | Kawartha Lakes | Kitchener-Waterloo & Cambridge | Muskoka District | Niagara Region | Northumberland County | Parry Sound District | Peterborough City & County | Prince Edward County