Toronto, Ontario - August 3, 2018 – the Toronto Real Estate Board’s monthly MarketWatch report was released this morning showing virtually all “plus signs” for residential MLS® sales reported by Toronto & GTA Realtors® in July. The sole “minus” sign was in front of the Average Chart - Toronto & GTA Home Sales Year-Over-Year Summary @ 2018-07Selling Price of the Detached sector in “The 905” area on the perimiter of the City of Toronto. But even that stat was virtually flat at -0.2% compared to last July. Unless otherwise noted, all figures herein are year-over-year comparisons due to the seasonality of the residential housing market. 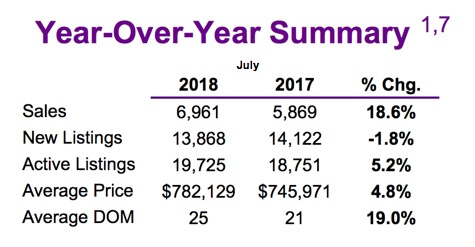
Overall - meaning all TREB areas and all residence types - 6,961 sales were reported by TREB members in July, an 18.6% jump versus last July when the market was stumbling out of it’s over-heated state and digesting the Ontario Government’s Fair Housing Plan. The overall average sale price in July was $782,129, up 4.8% YoY. It’s worthy to note that that average price figure was down from June’s $807,871 average and sales were also down from June’s 8,082 total - but, again, these are relatively normal fluctuations as the market moved from Spring to the slower Summer mode.
Inventory More “Normal”…
Also normal was a lower Total Active Listings [TAL] figure compared to June, though that was less of a drop than we’d normally see heading into the Dog Days of Summer [20,844 vs. 19,725 respectively]. That TAL figure was up 5.2% from last July’s 18,751. Residential properties newly listed in July totalled 13,868, 1.8% fewer new listings than last July.
Chart - Toronto & GTA Home Sales & Average Price by Major Home Type 2018-07What’s also interesting is that last July - probably as both sellers and buyers sensed a market top had been struck along with that new Housing Plan - TALs spiked 65.3% YoY…though that represented what’s considered a fairly typical total number for July [18,751].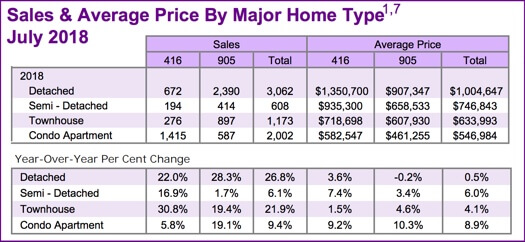
Based on those total sales & listings figures, the Absorption Rate [Total monthly sales/New listings] - an indication of how quickly the housing market is “absorbing” new inventory - stood at .502 [.418 twelve months ago]. The Indicated Forward Inventory figure [Total Active Listings/monthly sales] was 2.83 months [3.17 months last July; in March of last year that figure was .651….meaning less than 3 weeks of inventory]. Put another way, based on last month’s sales, it would take a little less than 3 months to sell off all the current inventory. That's pretty normal by historical standards.
Jason Mercer, the Board’s Director of Market Analysis: “We have certainly experienced an increase in demand for ownership housing so far this summer. It appears that some people who initially moved to the sidelines due to the psychological impact of the Fair Housing Plan and changes to mortgage lending guidelines have re-entered the market. Home buyers in the GTA recognize that ownership housing is a quality long-term investment.”
Looking at Specific Home Types…
There were 672 sales of Detached homes reported in Metropolitan Toronto, up an even twenty-two percent, at an average sale price of $1,350,700, up 3.6%. In the balance of the Greater Toronto Area there were 2,390 sales reported in the Detached group, up 28.3%, at an average price of $907,347, down two-tenths of a percentage point.
Condo apartments continued in popularity with sales in “The 416” up 5.8% to 1,415 units selling at an average of $582,547, up 9.2%. “The 905” saw 587 sales, up 19.1%, at an average if $461,255, up 10.3%.
The popularity of Bungalows also continued across the GTA to the where some Realtors® are even listing house styles such as sidesplits and backsplits as “Bungalows” in an attempt to attract more attention to their listings. To wit, the Canadian Real Estate Association [CREA] reports that - based on their Google®-generated search term trends - the #1 uptrending search term is “Bungalow” so far this year.
Generally…
“Home sales result in substantial spin-off benefits to the economy, so the positive results over the last two months are encouraging. However, no one will argue that housing supply remains an issue. The new provincial government and candidates for the upcoming municipal elections need to concentrate on policies focused on enhancing the supply of housing and reducing the upfront tax burden represented by land transfer taxes, province-wide and additionally in the City of Toronto,” said board President Garry Bhaura in the report.
It took “19% longer” to sell the average residence last month at 25 Days on Market versus 21 last July.
Set Up Your Own Customized SmartSearch
What's your property worth today?
JustBungalows.com Home Page
Questions? Comments? ...We'd ![]() to hear from you!
to hear from you!
Browse GTA Bungalows by City / Region:
Durham Region | Halton Region | Peel Region | Simcoe County | Toronto by Boroughs | York Region
Browse "Beyond the GTA" Bungalows by City / Region:
Brant & Brantford Township | Dufferin County | Grey County | Guelph & Wellington County | Haldimand County | Haliburton County | Hamilton [City] | Hastings County | Kawartha Lakes | Kitchener-Waterloo & Cambridge | Muskoka District | Niagara Region | Northumberland County | Parry Sound District | Peterborough City & County | Prince Edward County

