Greater Toronto, Ontario - Wednesday April 5, 2023 – The Toronto Region Real Estate Board’s monthly statistical publication, MarketWatch, was released this morning for March, 2023 by TRREB president Paul Baron showing tighter market conditions which have resulted in an increased frequency of multiple offer situations - a.k.a. “Bidding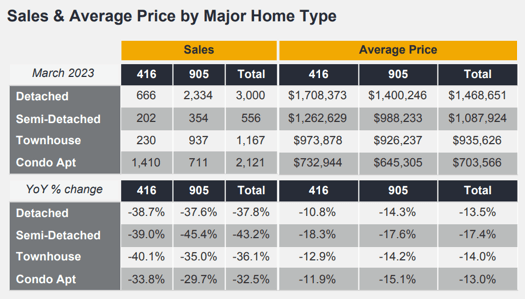 wars” - as competition has intensified amongst home buyers in many areas of Toronto and The GTA.
The report summarizes residential MLS® sales and listing activity across TRREB’s large market area. Making year-over-year - “YoY” - comparisons generally works best in the residential real estate market due to its seasonality: All figures quoted herein are YoY comparisons except where specifically noted otherwise.
Overall - meaning all home types across the entire market area - the average selling price of a home came in at $1,108,606. That represents a drop of 14.6% from last March… BUT that’s also a 6.7% increase in the average price in 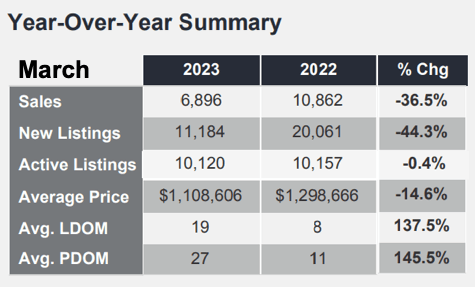 just two months: January 2023’s average was $1,038,668. Sales volume for March totalled 6,896 homes - still down substantially from a year earlier at -36.5% (10,862 homes sold last March).
The Inventory Story
Total available homes for sale at month-end, or “Total Active Listings” were 10,120 which was virtually unchanged from 10,157 (-0.4%).
“Forward Inventory” is calculated by dividing the Total Active Listings figure by the month’s sales volume which works out to just under one-and-one-half months of available listings at the current rate of sales. So sales are down significantly… and that inventory situation is still relatively tight by historical standards, though much better than we’ve seen it in recent years - and prices have turned up quite strongly. Interestingly, we noted last Spring that “with sales significantly lower it’s apparent that multiple offer scenarios have become much less the norm than they were”. Hmmm… The question: Is that it for "The Correction"?
A Look at some Major Home Types
Detached home sales in Metro Toronto were down 38.7% to 666 at an average selling price of $1,708,373, down “only” 10.8%. In the rest of the GTA, 2,334 Detached home sales were reported, down 37.6%, averaging $1,400,246, down 14.3%.
Condo Apartment sales totals came in at 1,410 in Toronto, down 33.8%, averaging $732,944, down 11.9%. The rest of the Board’s market area - “The 905”, generally speaking - saw 711 sales in March, down 29.7%, at an average selling price of $645,305, up 25.2%.
Quotable…
TRREB’s Chief Market Analyst Jason Mercer:
“Lower inflation and greater uncertainty in financial markets has resulted in medium-term bond yields to trend lower. This has and will continue to result in lower fixed rate borrowing costs this year. Lower borrowing costs will help from an affordability perspective, especially as tighter market conditions exert upward pressure on selling prices in the second half of 2023.”
Board President Paul Baron:
“As we moved through the first quarter, Toronto Regional Real Estate Board (TRREB) Members were increasingly reporting that competition between buyers was heating up in many GTA neighbourhoods. The most recent statistics bear this out,” said TRREB President Paul Baron. “Recent consumer polling also suggests that demand for ownership housing will continue to recover this year. Look for first-time buyers to lead this recovery, as high average rents move more closely in line with the cost of ownership.”
Board CEO John DiMichele
“As population growth continues at a record pace on the back of immigration, first-time buying intentions will remain strong. Because the number of homes for sale is expected to remain low, it will also be important to have substantial rental supply available. Unfortunately, this is not something we have at the present time. We need to see a policy focus on bringing more purpose-built rental units on line over the next number of years."
Homes took “137.5% longer to sell” this March at 19 Days on Market (“LDOM”) versus 11 days - though 19 days is still relatively “quick” by historical standards.
If you’re looking at some of the charts and wondering about the difference between “LDOM” versus “PDOM”, here’s a nano-course on that!: Listing Days on Market: The average number of days a property takes to sell under the current listing contract. Property Days on Market: The number of days the property was on market regardless of whether the property was listed more than once by the same brokerage. The latter is, obviously, more indicative of how long homes are taking to sell, but the PDOM figure is “incomplete” in that it doesn’t take into account the market time in the event a seller relists a home for sale with a different broker.
Thanks - as always - for reading! If we can help in any way with questions, the sell/buy process, etc., just drop us a line anytime…
Set Up Your Own Customized SmartSearch
What's your property worth today?
JustBungalows.com Home Page
Questions? Comments? ...We'd ![]() to hear from you!
to hear from you!
Browse GTA Bungalows by City / Region:
Durham Region | Halton Region | Peel Region | Simcoe County | Toronto by Boroughs | York Region
Browse "Beyond the GTA" Bungalows by City / Region:
Brant & Brantford Township | Dufferin County | Grey County | Guelph & Wellington County | Haldimand County | Haliburton County | Hamilton [City] | Hastings County | Kawartha Lakes | Kitchener-Waterloo & Cambridge | Muskoka District | Niagara Region | Northumberland County | Parry Sound District | Peterborough City & County | Prince Edward County

