
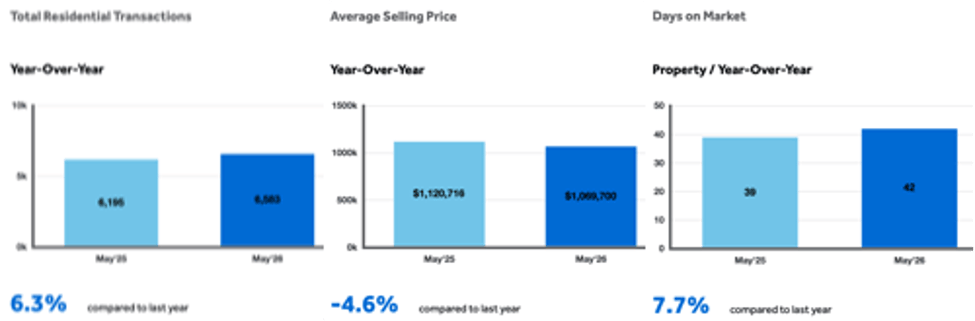
Greater Toronto, Ontario - Wednesday June 3, 2026 - Daniel Steinfeld, President of the Toronto Regional Real Estate Board [TRREB] today released the Board’s monthly Residential MLS® Market Statistics for May 2026 via their MarketWatch report showing higher sales combined with lower average sales prices and lower inventory. Obviously if sales volume continues to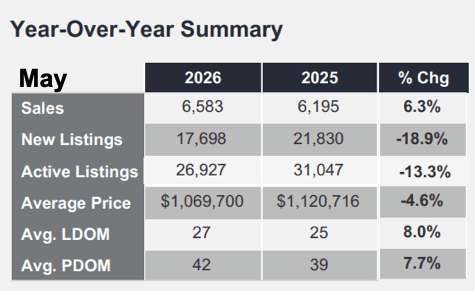 strengthen and inventory continues to contract, higher prices should follow.
Last May - JFTR - the “by-line” here was “May, 2025: Toronto & GTA MLS® home sales: Listings up; Sales down; Prices Steady-to-Lower”. We live in wonky times.
Overall…
Looking at stats across all of TRREB’s primary geographic area & all Types / Styles of home, sales volume totalled 6,583 in May - a 6.3% increase from last May.
The average selling price came in at $1,069,700, down 4.6% YoY and up 1.7% versus April 2026.
Bungalows continue to be a relatively hot commodity: In the last 2 full weeks of May Bungalow sales were running at about 27% of total sales. Actual Bungalow / One Storey style home inventory was about 23.5% of all inventory - meaning Bungalows were selling at a higher rate than sales of home styles overall - largely, of course, driven by demand from the “55+” downsizers cohort.
A year earlier, Bungalow sales were about 25¾% of the market; overall Bungalows represented about 21.4% of available homes for sale overall.
Unfortunately Board stats don’t break out much detail with respect to home “Style” [e.g. 1 Storey versus 2 Storey, etc]. It should be 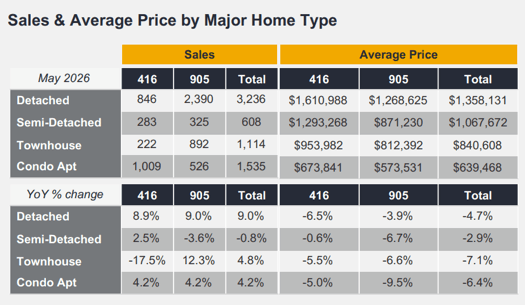 noted that the stats we pull to compare Bungalows to the overall market are for TRREB’s entire MLS® System whereas the stats provided via the MarketWatch release are for the Board’s “primary” “Toronto & GTA+” areas only.
More specific Bungalow statistics, average prices by City / Region, and more are available on our Bungalow “QuickStats” page here.
Residential real estate by its nature tends to be very “seasonal” - e.g. the hottest markets to coolest markets tend to be Spring, Fall, Summer, Winter in that order: All figures quoted here are year-over-year comparisons [unless otherwise noted] - as opposed to - for example, month-over-month - for that reason.
Specific Numbers…
In Metropolitan Toronto, Board Realtors® reported 846 sales of Detached homes in May, up a healthy 8.9%, at an average sale price of $1,610,988, off 6.5%. The balance of TRREB’s market area - The GTA + some peripheral Regions saw 2,390 Detached homes go under firm [e.g. unconditional commitment to purchase with a closing / completion date at some point in the future - generally 2 weeks to 6 months & sometimes even shorter or longer], up an even 9% at an average of $1,268,625, off 3.9%.
The Condo Apartment market continues to be pretty soft, though it did stick with the prevailing overall trend of “Sales Up, Prices Down”: Metro T.O. - “The 416” [area code] - was up 4.2% in terms of sales volume to 1,009 units at an average sale price of $673,841, down five percent even. The rest of the geographic market - “The 905” [area code] - mirrored that percent rise in volume at 526 units averaging $573,531, down 9.5%.
Quoting…
…from the Report:
TRREB Chief Information Officer Jason Mercer:
“Inventory levels trended lower over the past year, but buyers continued to have substantial negotiating power through the spring,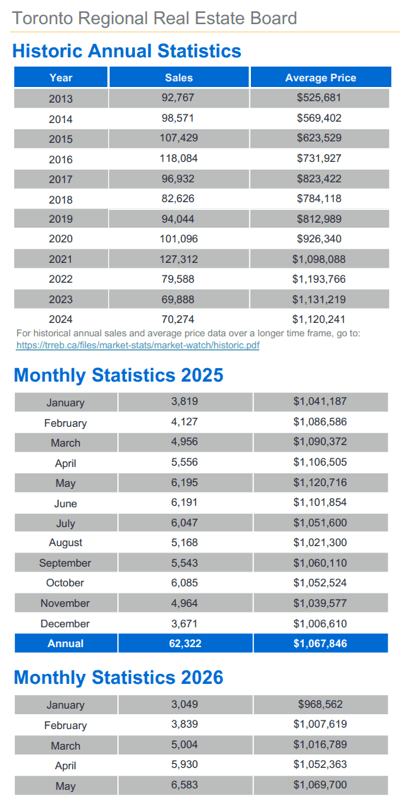 helping with affordability. Looking ahead, if sales strengthen further relative to listings, selling prices will level off and even start to grow as we move into 2027.”
TRREB CEO John DiMichele:
“TRREB supports Bill 98, the Building Homes and Improving Transportation Infrastructure Act of 2026, which contains a simple but critical truth: if we want more attainable housing, we need to make it easier, faster, and less expensive to build homes. Many of the concrete measures contained in Bill 98 align with recommendations in TRREB’s recently released policy report, Removing Roadblocks: Tackling Municipal Barriers to Housing Supply and Affordability in Ontario.”
TRREB President Daniel Steinfeld:
“Spring sales have been stronger than last year, reflecting improved affordability stemming from lower selling prices and borrowing costs. Sales are forecast to improve further as we move through the second half of this year. Recovery would be further bolstered by positive news on the trade front along with an easing of geopolitical tensions and related uncertainty.”
On Inventory…
It’s not uncommon to see inventory begin to contract as we head into the summer months & peeps focus moves to end-of-school, summer vacay, the beautiful summer weather, and so on. It’s been a peculiar year though on the inventory front in general.
Inventory fell pretty hard though in YoY terms at 26,927 Total Active Listings as of month-end, down 13.3%. Dividing TAL by the month’s sales volume [6,583] gives us a little over four months of “Forward Inventory” - pretty much in line with historical norms, actually. What that implies is that it would take 4 months to sell all the homes listed right now given a constant rate of sales volume. In other words, a snapshot of market “health” based on inventory versus sales volume.
“Absorption Rate” is all about how quickly the market’s “absorbing” homes available for sale and is based on the “New Listings” stat [which is less relevant than TAL in our opinion]. It’s calculated by dividing “Sales” by New Listings. That was .372 for May, up big from .286 a year earlier - no big surprise given the sales versus inventory numbers.
Homes took “8% longer” to sell in May at 27 Days on the Market [DoM] compared to 25. That remains - in historical terms - PDQ… Pretty Darned Quick… actually. It’s the good, well-priced properties that are selling relatively quickly, all in all. Many others are just sitting.
Thanks - as always - for stopping by. Gorgeous weather of late - assuming, of course, you’re into heat & humidity as I am. Enjoy… ⛱️🤿🏡🏕️☀️😎🌻🍉…
Andrew.
@JustBungalows @theBB.group
#JustBungalows #theBB.group #OntarioRealEstate #OntarioBungalows
Questions? Comments? ...We'd ❤️ to hear from you: You can drop us a line here!...
Set Up Your Own Customized SmartSearch
What's your property worth today?
Browse GTA Bungalows by City / Region
Durham Region | Halton Region | Peel Region | Simcoe County |
Toronto by Boroughs | Toronto by Neighbourhoods | York Region
Browse "Beyond the GTA" Bungalows by City / Region
Brant & Brantford Township | Dufferin County | Grey County | Guelph & Wellington County | Haldimand County | Haliburton County | Hamilton [City] | Hastings County | Kawartha Lakes | Kitchener-Waterloo & Cambridge | Muskoka District | Niagara Region | Northumberland County | Parry Sound District | Peterborough City & County | Prince Edward County