Toronto, Ontario, December 5th, 2023 - The Toronto Regional Real Estate Board [TRREB] released its monthly statistical update, “MarketWatch”, this morning confirming that overall - meaning all home classes, types & styles across the entirety of TRREB’s market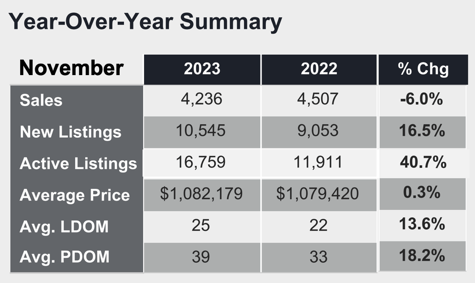 area - sales volume was moderately weaker compared to last November and, with higher inventory available - which is a blessing from the standpoint of anyone who’s been trying to buy a home for the past couple of years - selling prices were mixed, but generally “flat-to-negative”.
The Big Picture
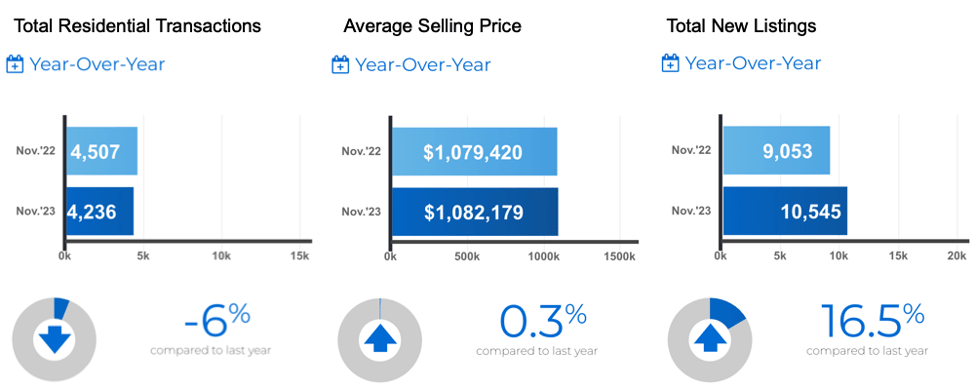
The total number of homes sold on the month came in at 4,236 which was a six percent drop from last November. The average sale price of those homes sold was $1,082,179. That was virtually unchanged at -0.3%.
 All figures - due to the strong seasonality of the residential real estate market - are year-over-year [YoY] comparisons unless otherwise noted.
A month earlier - meaning October, 2023 - there were 4,646 home sold averaging $1,125,928, just for the record.
Specific Numbers
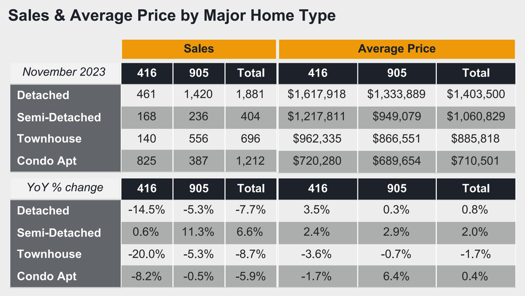
In Metro Toronto - “The 416” area code if you use what’s becoming outdated terminology… or “YYZ” in international airport parlance! - the Detached home group totalled 461 sales on the month, a 14.5% drop, averaging $1,617,918 which was up 3.5%. The balance of the GTA - “The 905" in the ol’ area code references - 1,420 Detached homes sold, off 5.3%, at an average sale price of $1,333,889, flat at +0.3%.
MLS sales of Condo Apartment in Metro T.O. were off 8.2% to 825 units at an average of $720,280, off a bit at -1.7%. The rest of the “extended GTA” TRREB market area saw 387 units sell, almost unchanged at -0.5%, averaging $689,654, the strongest “average price” gain of the major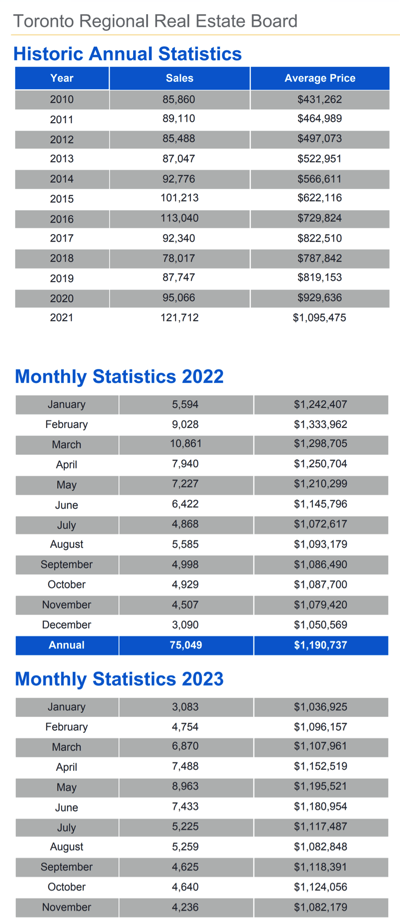 home types at +6.4%.
Quoting From the Report…
TRREB President Paul Baron:
“Inflation and elevated borrowing costs have taken their toll on affordability. This has been no more apparent than in the interest-rate-sensitive housing market. However, it does appear relief is on the horizon. Bond yields, which underpin fixed rate mortgages have been trending lower and an increasing number of forecasters are anticipating Bank of Canada rate cuts in the first half of 2024. Lower rates will help alleviate affordability issues for existing homeowners and those looking to enter the market.”
TRREB Chief Market Analyst Jason Mercer:
“Home prices have adjusted from their peak in response to higher borrowing costs. This has provided some relief for buyers, from an affordability perspective. As mortgage rates trend lower next year and the population continues to grow at a record pace, expect demand to increase relative to supply. This will eventually lead to renewed growth in home prices.”
TRREB CEO John DiMichele:
“Houses and condos are meant to be homes, first and foremost. We know the demand for homes, both rental and ownership, will grow for years to come. We have seen some productive policy decisions recently that should help with housing affordability, including allowing existing insured mortgage holders to switch lenders without the stress test. Additionally, in the interest of household and economic stability, we continue to call on the Office of the Superintendent of Financial Institutions (OSFI) to apply the same approach to uninsured mortgages. It also goes without saying that further policy work is required to bring more supply online.”
A Quick Look at the Inventory Situation…
Residential properties newly listed in November totaled 10,545, up 16.5%. More importantly - in our opinion - and more on the “good news for home buyers front - is that the “Total Active Listings” figure was 16,759 as of month-end, a 40.7% jump YoY.
As we’ve contended here before many times: We don’t see a “housing crisis”; we see an affordability crisis. Two different things. One implies supply... the other doesn't necessarily. Regardless, the old adage rings true once again: “When the average family can no longer afford the average home, something’s gotta give.”
“Unsustainable” has been the mantra of many - particularly outside the “MSM” - main stream media - for many, many months and it appears that that’s now slipped into reverse. We’ll see how far she runs…
“Forward Inventory” gives us a snapshot of how many weeks or months of available inventory are currently on the market based on that Total Active Listings figure versus the current rate of sales. It’s calculated simply by dividing the former by the latter. At month-end, that came to 3.96 months. With historic norms around the three-to-four month range, we’ve finally got back to that point after seeing inventory so tight it drove sales prices… and a whole bunch of “FOMO”... as it got as low as a couple of weeks at some points. Artificially low interest rates didn’t help the situation.
Once again the question, naturally, “Where do we go from here?”.
To precisely nobody’s surprise, it took a little longer to sell a home in our market area last month at 25 Days on the Market [“DoM”]… or “13.6% slower” than the 22 days last November. “Normal” DoM, historically speaking - if that’s even relevant anymore! - is about 60 to 90 days. Maybe even a little longer, depending… but, remember, those are the homes that actually sold.
The property days on market [“PDOM”] figure includes situations where property listings were terminated and - often - “prices improved” as the new vernacular puts it [as opposed to “price reduction” for us seasoned vets used to say!] - subsequently re-listed. BUT it only reflects those listed with the same brokerage. Not the ones who moved on to another agent.
That PDOM number was 39 days versus 33 [or “18.2% slower"], just for the record.
The days shorten and The Holidays will soon be upon us. Take care out there, and #Enjoy !!
Thank-you for dropping in, as always. Message us anytime with questions, comments… good, bad or ugly!
Andrew.
Questions? Comments? Drop us a line!…
Set Up Your Own Customized SmartSearch
What's your property worth today?
JustBungalows.com Home Page
Questions? Comments? ...We'd  to hear from you!
Browse GTA Bungalows by City / Region:
Durham Region | Halton Region | Peel Region | Simcoe County | Toronto by Boroughs | York Region
Browse "Beyond the GTA" Bungalows by City / Region:
Brant & Brantford Township | Dufferin County | Grey County | Guelph & Wellington County | Haldimand County | Haliburton County | Hamilton [City] | Hastings County | Kawartha Lakes | Kitchener-Waterloo & Cambridge | Muskoka District | Niagara Region | Northumberland County | Parry Sound District | Peterborough City & County | Prince Edward County

