TORONTO, ONTARIO, November 2, 2018 - We must admit - we were hoping that the widely anticipated Toronto MLS® Residential sales figures for October, 2018 would be released by the Toronto Real Estate Board today...but we'll have to wait for next week it appears. So - we thought we'd throw some darts at the TREB map and put together some "unofficial" statistics - "Quick Market Updates" - for one area in each of the primary GTA "regions" - including one each for the five old Toronto boroughs - just to get a feel for what's going on out there in terms of house & condo sales volume, prices and inventory - as well as some specific numbers for the Bungalow category.
While Bungalows are - obviously - close to our hearts here at JustBungalows, it's interesting [if not all that surprising] to note that "Bungalow" as a search term was recently the #1 term searched at the Canadian Real Estate Association's site, Realtor.ca.
Below we offer you several charts taken from Toronto MLS® searches to convey stats such as Median & Average sales prices for each of the areas; Days on Market; etc., and corresponding figures for October, 2017. We've also split out some Bungalow-specific numbers for each area [again, Year-over-Year] - just to illustrate how Bungalows compare to the bigger picture.
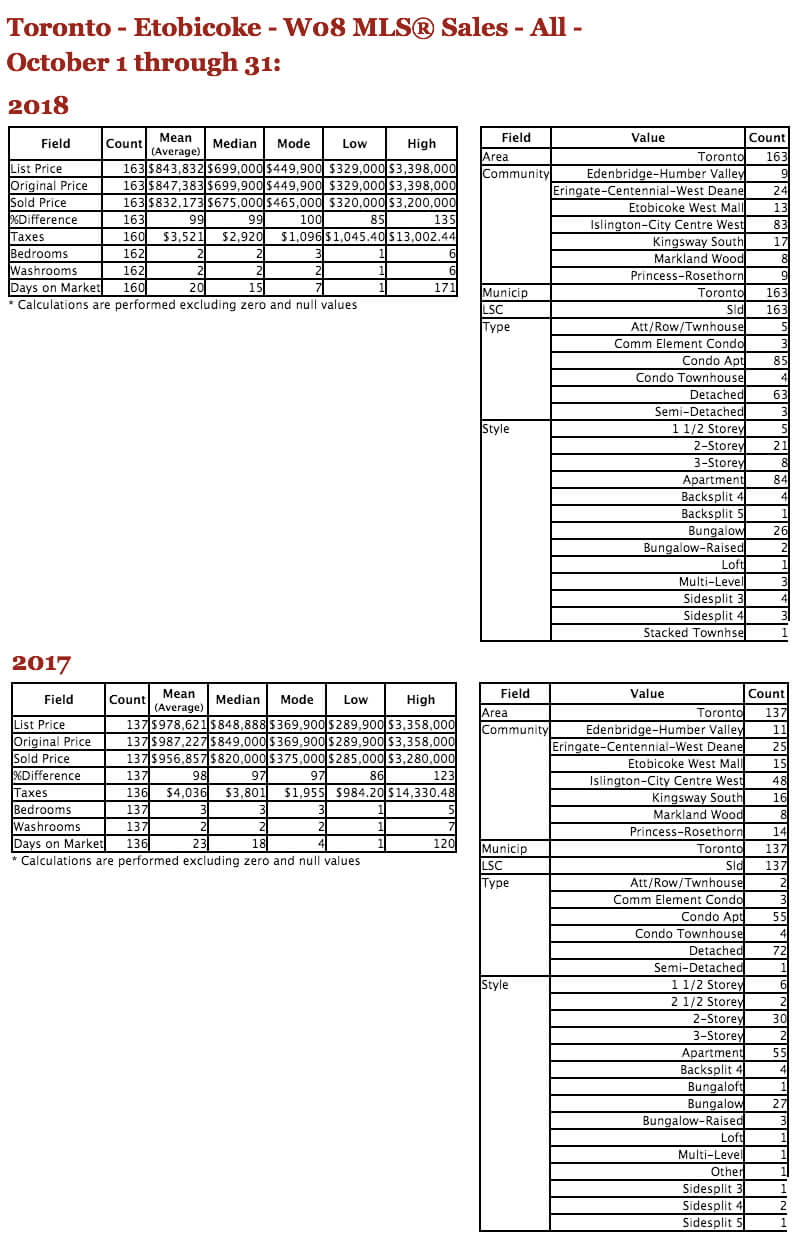
It's apparent that while the predominant trend is toward more moderate price ranges, there are broad divergences neighbourhood-to-neighbourhood around the GTA. Further, just because average prices have fallen or risen in a given area doesn't mean the price of a given house or condo has fallen or risen to the degree indicated by these stats. A great example of this is the Etobicoke W08 stats summary below: Broadly based statistical reporting indicates that average prices are down 15%. But it also indicates that - on average - homes sold "15% more quickly" which doesn't add up: Why would price be so significantly impacted to the negative side while homes sold so much faster? The answer, of course, lies in what's selling - a likely component of which is available inventory along with affordability. Last October, 55 Condo Apartments sold and 72 Detached homes sold. This October, 85 Condo Apartments sold and 63 Detacheds sold. That's a pretty hefty shift which also explains - largely - the drop in Median sale price from $820,000 to $675,00. The broader market numbers - due out any day now - should shed more light. Regardless, we'd again encourage you to get your own Neighbourhood info updates here.
The inventory numbers are based on "Listing Entry Date" - listings actually entered into the TREB MLS® System during the month. The residential TAL - or "Total Active Listings" - figures weren't available at the time of writing.
Let us know if you'd like a Quick Market Update like these for your own 'hood...or any other Town/Area that might be of interest to you. We also offer updates direct to your email Inbox for virtually any criteria and any area you want to keep an eye on - Yup -we can now send you the ??????????"Sold" info ?????????? as well - with some basic info right here, including Daily, Weekly or Monthly frequency - your choice...
Quick Market Updates
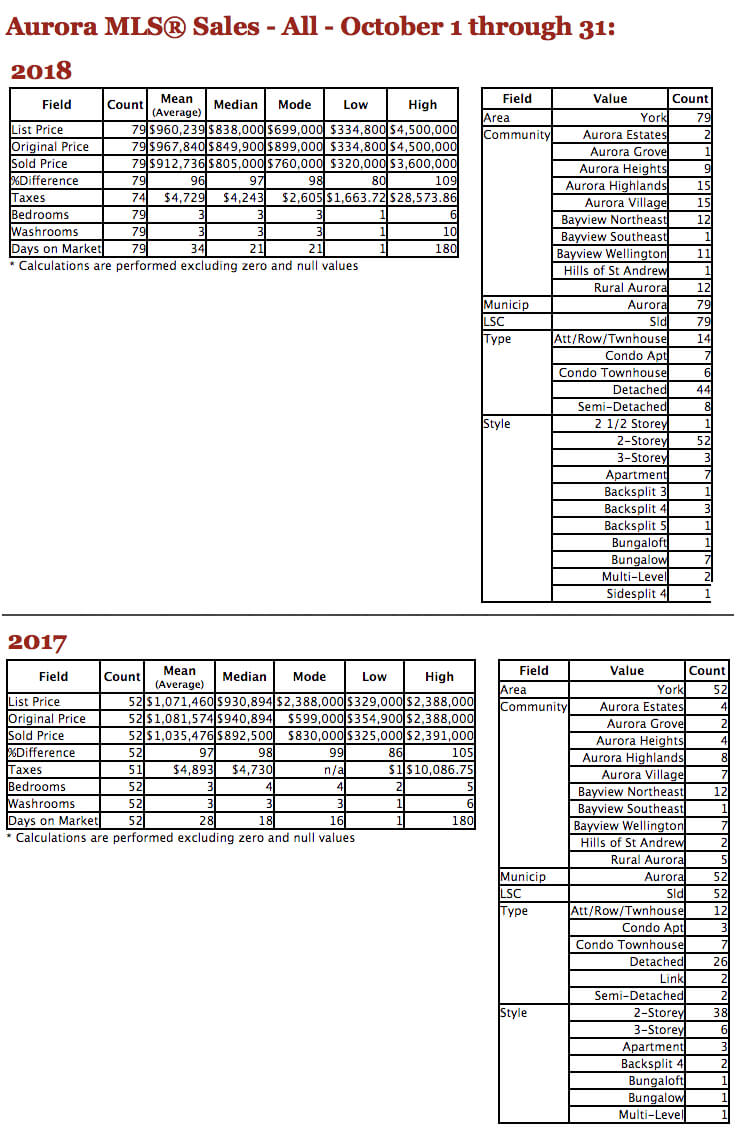
Aurora [York Region]:
Total Sales up 51.9%; Average price down 9.7%; Days on Market up 21.4%. Eight Aurora Bungalows sold - compared to 2 last October - at an average price of $927,250, down less than one percent.
Inventory of homes listed for sale in Aurora in October [last October's numbers in brackets]: 227, including 12 Bungalows [249 including 30 Bungalows].
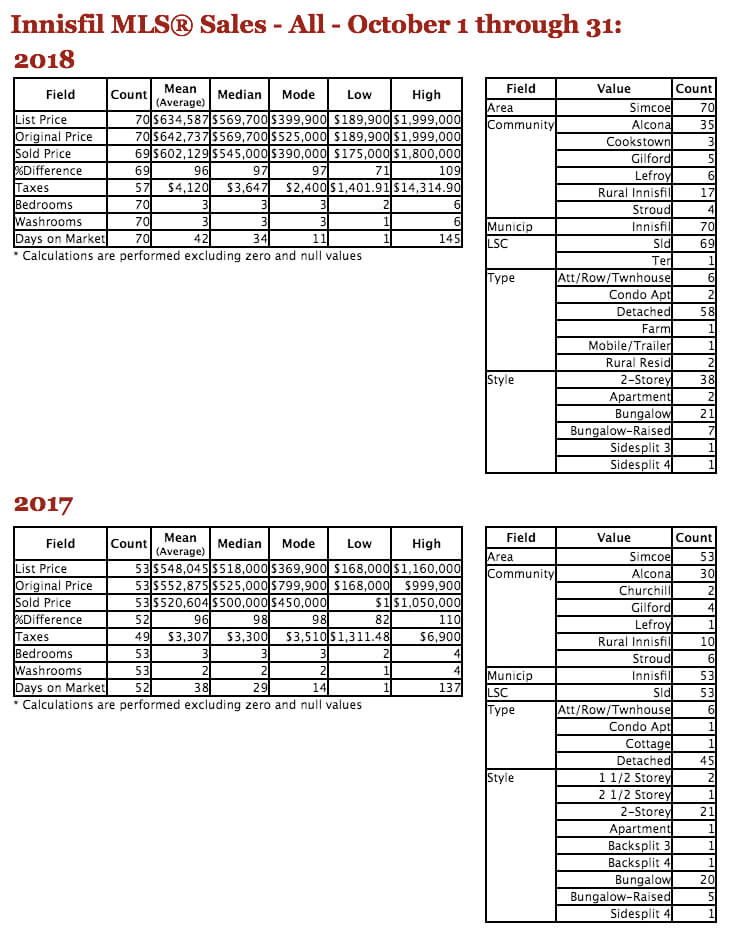
Innisfil [Simcoe County]:
Total Sales up 32.1%; Average price up 15.7%; Days on Market up 10.5%. 28 Innisfil Bungalows sold - up 12% from last October - at an average price of $474,675, up 3.5%.
Inventory of homes listed for sale in Innisfil in October [last October's numbers in brackets]: 206, including 79 Bungalows [200 including 63 Bungalows].
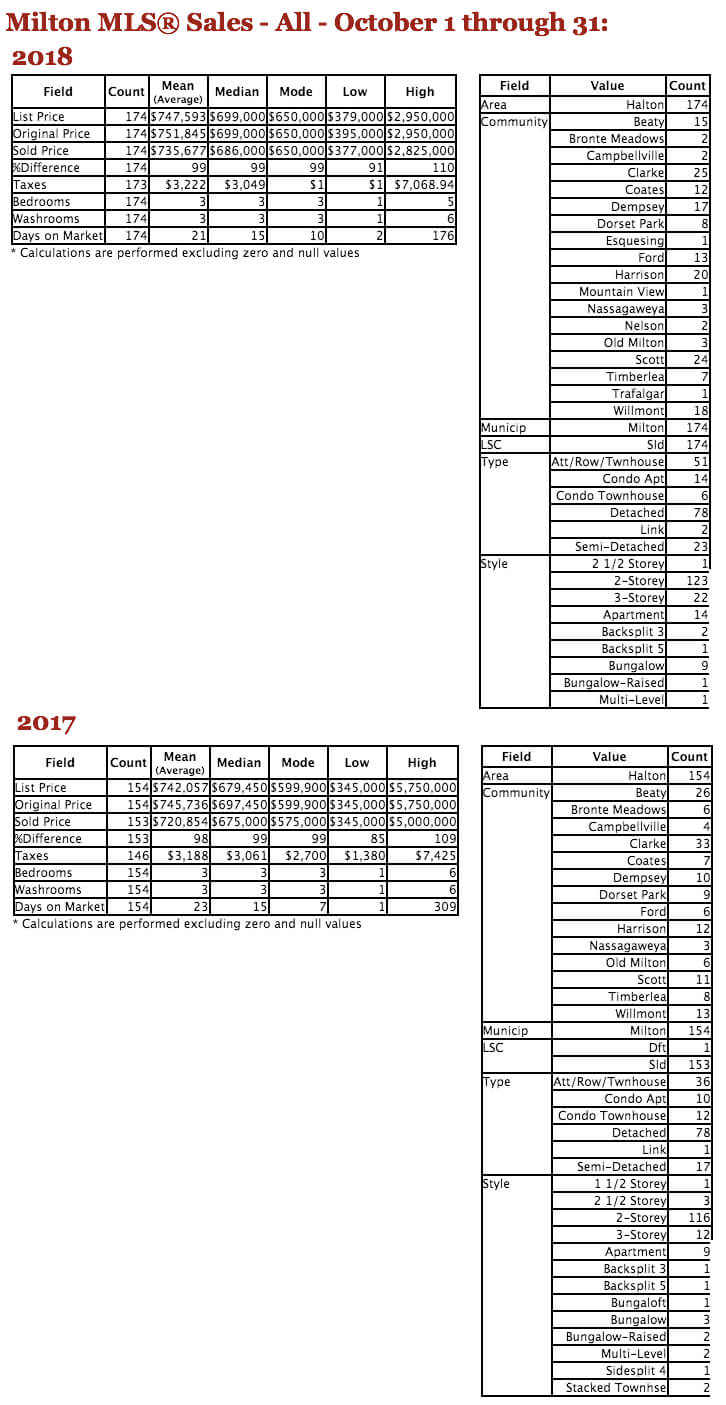
Milton [Halton Region]:
Total Sales up 13%; Average price up 2%; Days on Market up 8.7%. Ten Milton Bungalows sold - up 66.7% from last October's total of six - at an average price of $1,013,603 compared to $676,150 a year earlier. Obviously some "skew" going on in that number...the Median sale price was $785,514 which was still a 23.7% jump YoY.
Inventory of homes listed for sale in Milton in October [last October's numbers in brackets]: 315, including 14 Bungalows [341 including 18 Bungalows].
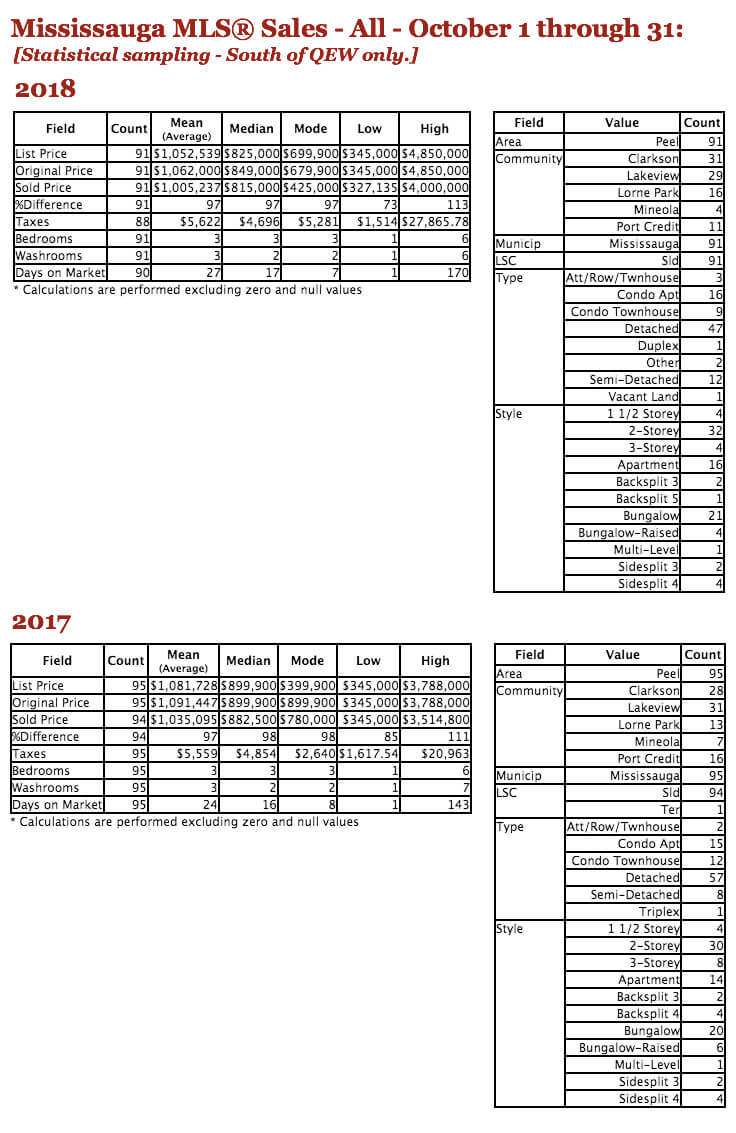
Mississauga [South of The QEW only] [Peel Region]:
Total Sales down 4.2%; Average price down 2.9%; Days on Market up 12.5%. Twenty-five Mississauga Bungalows sold [again - we're only looking at the Neighbourhoods south of the Queen Elizabeth Way] - versus 26 last October - at an average price of $1,105,136, up 22%. The Median Bungalow sales figures were $975,000 and $862,500.
Inventory of homes listed for sale in "Mississauga South" in October [last October's numbers in brackets]: 188, including 56 Bungalows [218 including 53 Bungalows].
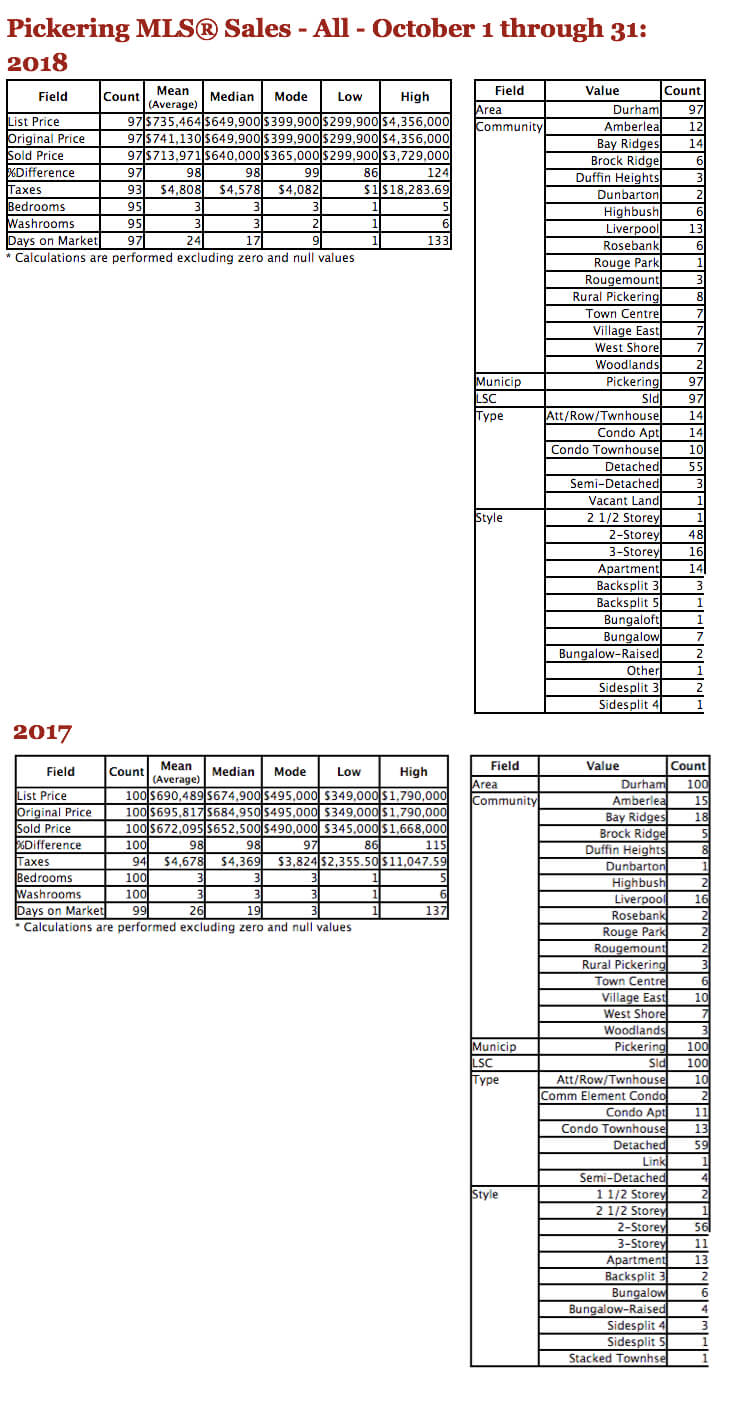
Pickering [Durham Region]:
Total Sales down 3%; Average price up 6.2%; Days on Market up down 7.7%. Ten Pickering Bungalows sold - exactly the same number as last October - at an average price of $959,449, up 14.2%.
Inventory of homes listed for sale in Pickering in October [last October's numbers in brackets]: 199, including 29 Bungalows [235 including 23 Bungalows].
Toronto W08 [in the former Borough of Etobicoke]:
Total Sales up 19%; Average price down 15%; Days on Market also down 15%. Twenty-eight "Toronto W08" Bungalows sold - versus 31 a year earlier - at an average price of $958,150 down 3.7%.
Inventory of homes listed for sale in Toronto's W08 district of Etobicoke in October [last October's numbers in brackets]: 272, including 42 Bungalows [220 including 39 Bungalows].
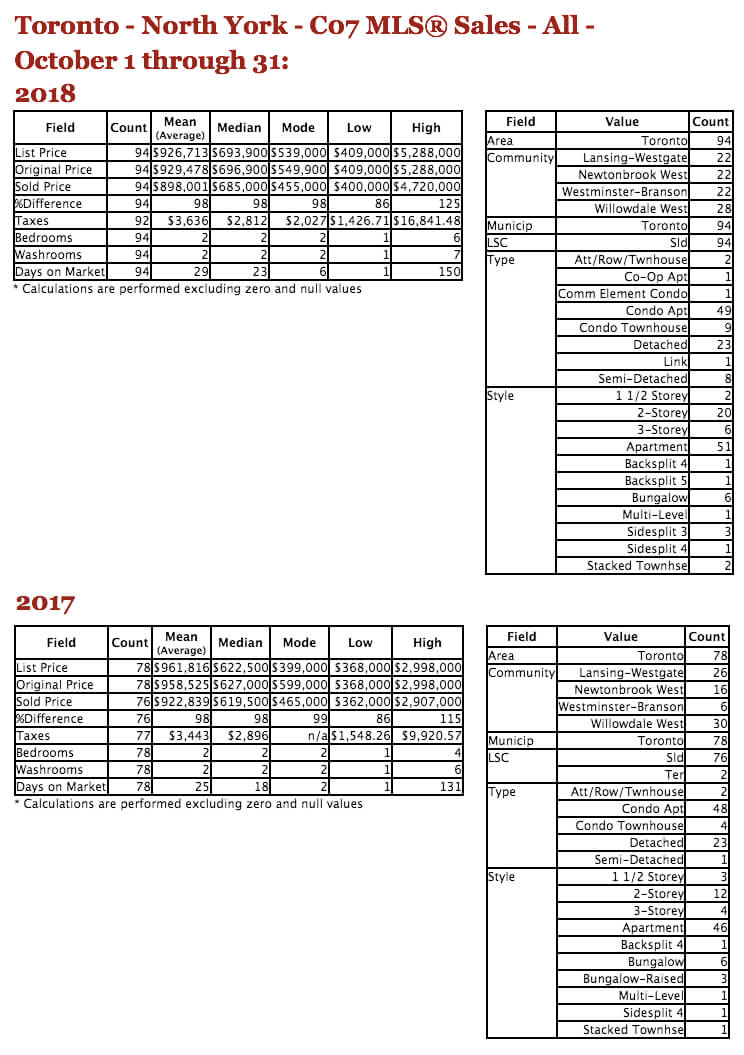
Toronto C07 [in the former Borough of North York]:
Total Sales up 20.5%; Average price down 2.7%; Days on Market up 16%. Six Toronto "C07" Bungalows sold - down 33% from last October's 9 - at an average price of $1,182,500, down 19.6%.
Inventory of homes listed for sale in Toronto's C07 district of North York in October [last October's numbers in brackets]: 202, including 18 Bungalows [228 including 24 Bungalows].
Toronto C02 [in the "Old Toronto" area]:
Total Sales up 19.2%; Average price up 13.3%; Days on Market down 29.6%. There were no Bungalows sold in the area, though one was listed for sale. Two were listed for sale last October.
Inventory of homes listed for sale in Toronto's C02 district of "Old T.O." in October [last October's numbers in brackets]: 165, including that one lonely Bungalo [130 including the 2 Bungalows noted].

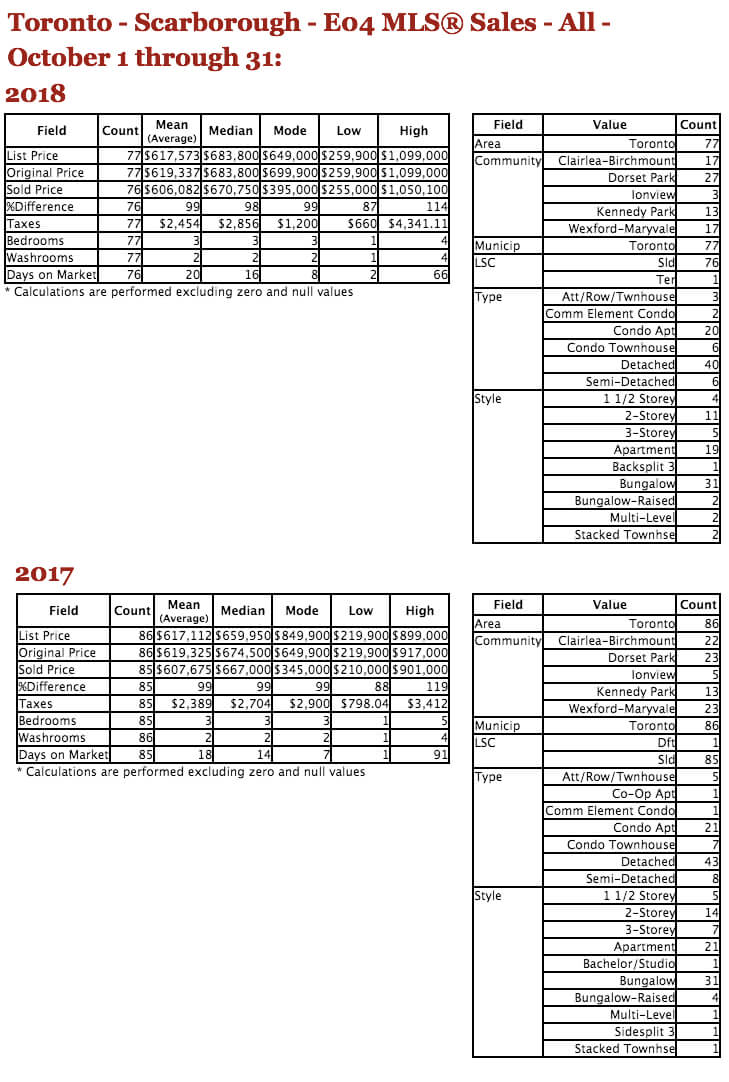
Toronto E04 [in the former Borough of Scarborough]:
Total Sales down 10.5%; Average price was virtually unchanged [-.3%]; Days on Market up 11.1%. Thirty-three Toronto "E04" Bungalows sold - down 5.7% - at an average price of $733,322, down three point one percent.
Inventory of homes listed for sale in Toronto's E04 district of Scarborough in October [last October's numbers in brackets]: 143, including 54 Bungalows [172 including 63 Bungalows].
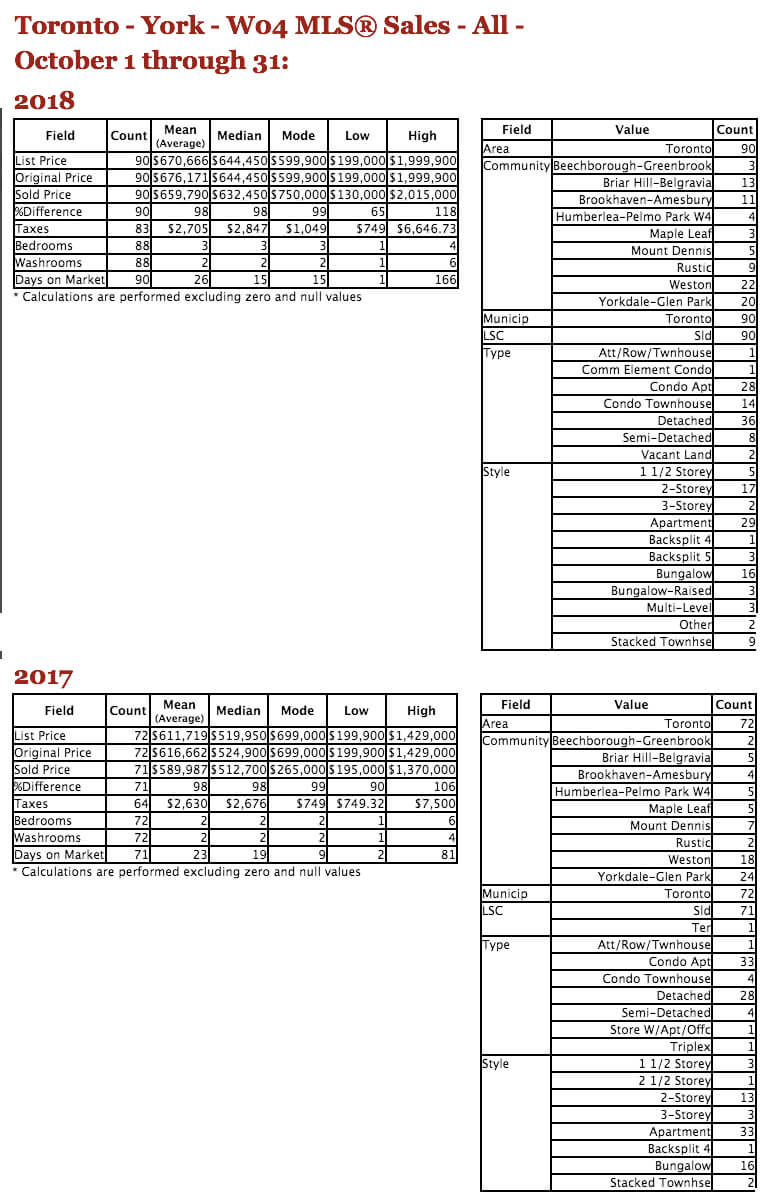
Toronto W04 [in the former Borough of York]:
Total Sales up 25%; Average price up 11.8%; Days on Market up 13%. Nineteen Toronto "W04" Bungalows sold - 18.8% more than last year - at an average price of $817,442, off 10.9% YoY.
Inventory of homes listed for sale in Toronto's W04 district of York in October [last October's numbers in brackets]: 138, including 32 Bungalows [149 including 33 Bungalows].
Set Up Your Own Customized SmartSearch
What's your property worth today?
JustBungalows.com Home Page
Questions? Comments? ...We'd ![]() to hear from you!
to hear from you!
Browse GTA Bungalows by City / Region:
Durham Region | Halton Region | Peel Region | Simcoe County | Toronto by Boroughs | York Region
Browse "Beyond the GTA" Bungalows by City / Region:
Brant & Brantford Township | Dufferin County | Grey County | Guelph & Wellington County | Haldimand County | Haliburton County | Hamilton [City] | Hastings County | Kawartha Lakes | Kitchener-Waterloo & Cambridge | Muskoka District | Niagara Region | Northumberland County | Parry Sound District | Peterborough City & County | Prince Edward County

