
Toronto, Ontario, September 6, 2017 - MarketWatch, The Toronto Real Estate Board’s monthly statistical report, came out today revealing - on most fronts - a continuation of the recent trend…namely lower sales as the market adjusts to price spikes, Fair Housing Plans, and huge rises in the number of active listings…not to mention the dog days of summer… 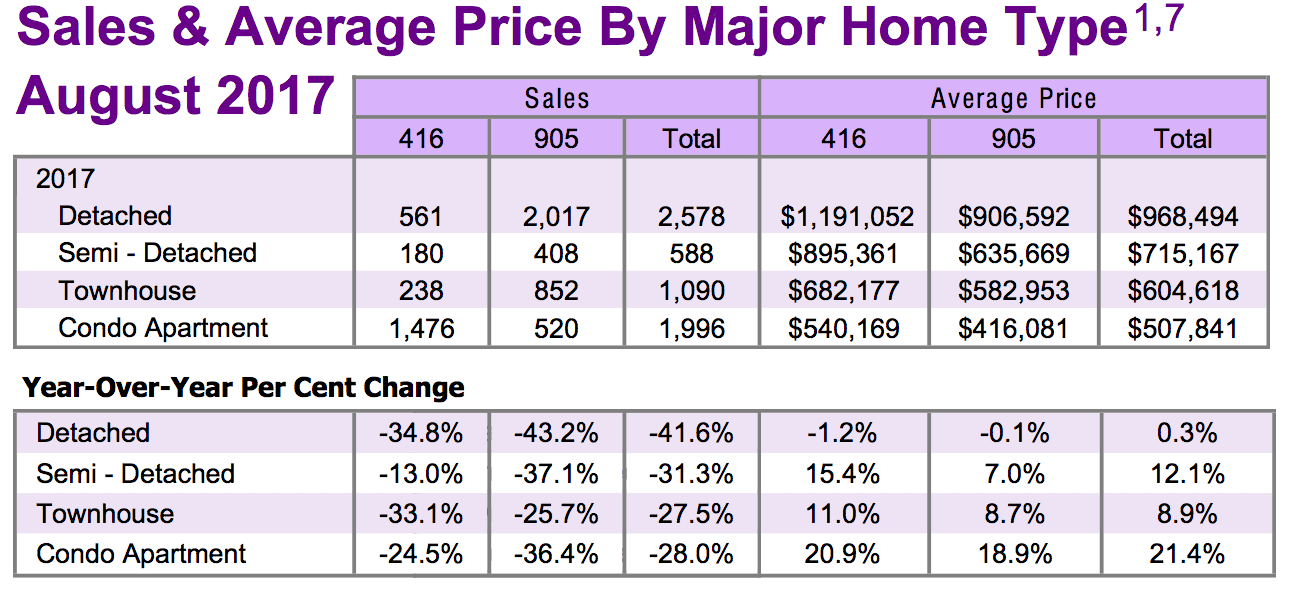
Once again, as sales volume tumbled [to put it mildly] across the board, prices in the Condo Apartment sector bucked the trend and continued to post strong gains.Price gains were also good for Semi-Detacheds and for Townhomes; not so much for the Detached group.
All figures are year-over-year comparisons unless otherwise noted.
Toronto & GTA Realtors® reported 6,357 residential property sales overall - meaning all TREB areas and all home types - through their MLS® system last month, down 34.8% versus August’s 9,748. The volume of sales was down sharply for all home types, right across TREB’s market area.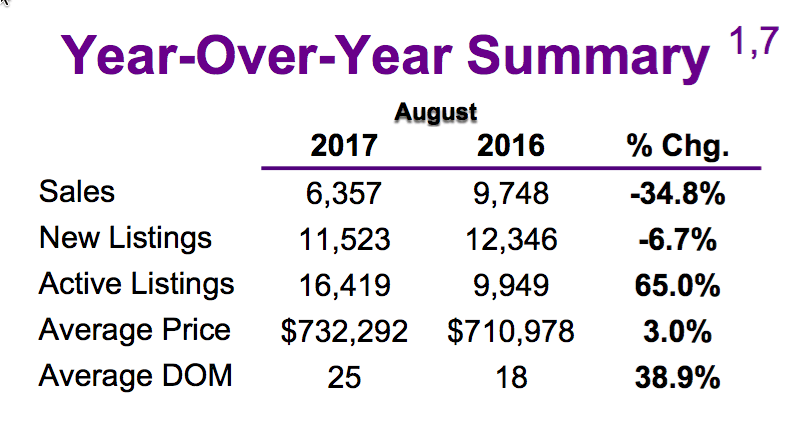
In Toronto “proper”, 561 Detached homes sold, off 34.8%, at an average selling price of $1,191,052, down 1.2%. In “The 905" - the balance of the GTA - 2,017 Detached homes went under contract in August, down 43.2%, at an average selling price of 906,592 which was virtually unchanged from last August [-0.1%]. Overall, Detached sales, then, were off 41.6% YoY…
Sales of Condo Apartment units were also off sharply once again, but that volume weakness didn’t show up in prices: In Metro Toronto, 1,476 Condo Apartments traded in August, down 24.5%, at an average price of $540,169, up 20.9%. In the rest of the Greater Toronto Area, 520 units sold, off 36.4%, for an average $416,081, up 18.9%.
Not surprisingly, given the market and the time of year, houses took “38.9% longer” to sell at 25 Days on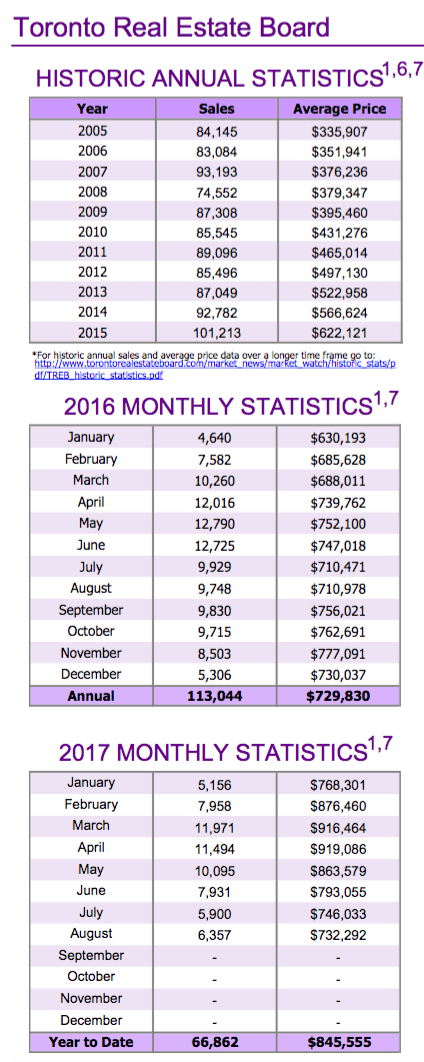 Market on average compared to to 18 days last August. 25 days to sell is still low by historical standards.
“MarketWatch” quoted TREB President Tim Syrianos, “Recent reports suggest that economic conditions remain strong in the GTA. Positive economic news coupled with the slower pace of price growth we are now experiencing could prompt an improvement in the demand for ownership housing, over and above the regular seasonal bump, as we move through the fall.”
It could. Chipped in TREB’s Director of Market Analysis, Jason Mercer, “The relationship between sales and listings in the marketplace today suggests a balanced market. If current conditions are sustained over the coming months, we would expect to see year-over-year price growth normalize slightly above the rate of inflation. However, if some buyers move from the sidelines back into the marketplace, as TREB consumer research suggests may happen, an acceleration in price growth could result if listings remain at current levels.”
Set Up Your Own Customized SmartSearch
What's your property worth today?
JustBungalows.com Home Page
Questions? Comments? ...We'd  to hear from you!
Browse GTA Bungalows by City / Region:
Durham Region | Halton Region | Peel Region | Simcoe County | Toronto by Boroughs | York Region
Browse "Beyond the GTA" Bungalows by City / Region:
Brant & Brantford Township | Dufferin County | Grey County | Guelph & Wellington County | Haldimand County | Haliburton County | Hamilton [City] | Hastings County | Kawartha Lakes | Kitchener-Waterloo & Cambridge | Muskoka District | Niagara Region | Northumberland County | Parry Sound District | Peterborough City & County | Prince Edward County