Toronto, Ontario, September 6, 2018 - The August, 2018 home sales stats were released this morning by the Toronto Real Estate Board [TREB] showing the market is building - so far - on the stability we saw in June & July. While there have been significant problems for some buyers - particularly those who bought new, unbuilt homes at higher prices many months earlier and had difficulty mortgaging at closing time after market values had softened - all in all the market appears to have moved on from the natural cooling and the “policy shocks” seen in the Spring of 2017. Again, “so far”. 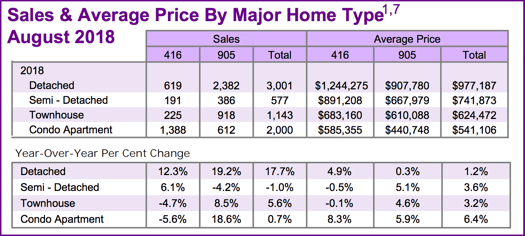
Compared to the prior month specifically, all of the overall numbers [Sales, New Listings, Total Active Listings, Average Price & Days on Market] were off marginally but that’s a normal seasonal softening as people vacation and begin getting children ready for back-to-school.
While many had feared spiking interest rates, the benchmark 5 year mortgage rate was only half a percent higher at 5.34% compared to 4.84% a year prior - both still pretty cheap money by historical standards. Hopefully rates don’t jump when…if…a deal finally comes together on NAFTA. Real GDP Growth numbers were also good for Q2 of this year, though not as good as Q2 2017 [+2.9% vs +4.3%]. Real GDP Growth for Q1 2018 was down 1.3%.
All figures refer to sales reported by member Realtors® through TREB’s MLS® System with comparisons being Year-over-year - due to the seasonal fluctuations in the residential real estate market - unless otherwise noted. Some charts & statistics are Copyright© TREB.
One of the brightest spots in the report was the continued bounce-back in activity in the Detached homes group. In Metro Toronto, that group’s sales were up 12.3% YoY to 619 units at an average sale price of $1,244,275, up 4.9%. In “The 905” area code - referring to the balance of the Greater Toronto Area - 2,382 Detached homes sold representing a 19.2% jump at an average of $907,780 which was relatively flat at +0.3%. Sales of other Freehold house styles - namely Semi-Detached and Townhouses - were mixed and prices of those were off slightly in Toronto but up about 5% in average sale price for the rest of the GTA.
The volume of sales of Condo Apartments was also “A Tale of Two Markets”, though the selling price was relatively strong across TREB’s market area. In Toronto, 1,388 units were reported sold, down 5.6%, at an average of $585,355, up 8.3%. Sales volume in the balance of the GTA jumped 18.6% to 612 units averaging $440,748, up 5.9%. It appears that Toronto’s relatively weak sales number combined with pretty solid price growth can be attributed to our old friend, “tight inventory”.
Overall - meaning all residence types and the entire Toronto Real Estate Board market area - the number of sales was up 8.5% to 6,839 at an average sale price of $765,270. Note the charts are included here covering those overall figures for this August as well August 2017 and 2016, just for comparison. You’ll also notice that the numbers differ in those charts as adjustments are always made after the initial report is released in order to account for duplicate listings [usually duplicated due to overlapping Boards, etc.] and other factors.
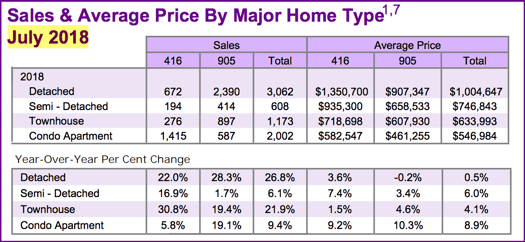
Newly listed residences totalled 12,166 overall, up an even 6%. The Total Active Listings [TAL] stood at 17,864 representing 8.8% more inventory than last August. Overall average price was up 4.7% to $765,270. Again, that was off slightly from July’s $782,129. We’ve included the July chart of “Sales & Average Price” below, again just so you can compare the more recent numbers as this market contines to “adjust”.
Homes on average took “8% longer to sell” this August at 25 Days on Market [DOM] versus 21 one year earlier. A DOM of 25 is still pretty quick to sell by historical standards. Then again, that figure has become somewhat skewed in recent years given the more common practice of “Terminating” a listing when the asking price is being reduced [or just to “freshen the listing up” for that matter]. “Back in the day” listings were simply “Re-run”…meaning edited - rather than completely terminating and then re-listing from scratch, generally speaking. The more recent practice not only gives the appearance of a faster sale, it also gives the appearance of houses generally selling much closer to their true original asking price.
Speaking of quick sales, Bungalows remain in very high demand - and, therefore, limited supply - for a number of reasons. Many people are looking to “downsize” to a Bungalow from larger family home as the kids fly the coop. A lower price entry point and the Bungalow's general “affinity” for creating an additional unit - usually in the basement - in order to help with the mortgage & other expenses can make them attractive financially, particularly to single people & first-time Buyers. Contractors also take a specific interest in the “single-storey” option since these houses aren’t only often out-dated and represent a quick shine & flip opportunity, they can also be extended upward for a larger construction project and more profit potential. Of course, given that they’re often situated on larger lots means it’s usually feasible to extend them outward, as well.
A hurdle for some of the downsizing folks “Thinking Bungalow” seems to be this, though: Per square foot, a Bungalow can be more expensive than other house styles. The reason is simple: Since all houses require the roof and the basement/foundation structure, only building one floor in between results in the overall higher cost per square foot. Often with the Bungalows, though - generally in the older parts of town - you very often get some mature trees, not to mention that larger lot for a garden, added privacy, and general “elbow room”. They’re also easier - being only one storey - to heat and to maintain.
“Forward Inventory” [TAL of 17,864 / Monthly Sales of 6,839] stood at 2.61 months which indicates a relatively balanced market at the moment. The “Absorption Rate” - meaning the rate at which the market’s absorbing new inventory [Monthly Sales of 6,839 / New Listings of 12,166] was .562.
Thanks for reading - we hope you’ll be back soon. If you’re considering a move, please do drop us a line for an informal chat…we’d ?????? to hear from you!
[Note: That July 2018 "Sales & Average Price..." summary chart is included below.]
Set Up Your Own Customized SmartSearch
What's your property worth today?
JustBungalows.com Home Page
Questions? Comments? ...We'd ![]() to hear from you!
to hear from you!
Browse GTA Bungalows by City / Region:
Durham Region | Halton Region | Peel Region | Simcoe County | Toronto by Boroughs | York Region
Browse "Beyond the GTA" Bungalows by City / Region:
Brant & Brantford Township | Dufferin County | Grey County | Guelph & Wellington County | Haldimand County | Haliburton County | Hamilton [City] | Hastings County | Kawartha Lakes | Kitchener-Waterloo & Cambridge | Muskoka District | Niagara Region | Northumberland County | Parry Sound District | Peterborough City & County | Prince Edward County

