Toronto - February 5, 2018 - Greater Toronto Area Realtors® released the January, 2018 residential resale property stats today showing - as had been widely anticipated - an accross-the-board drop in the number of sales reported through the Toronto Real Estate Board’s MLS® System. 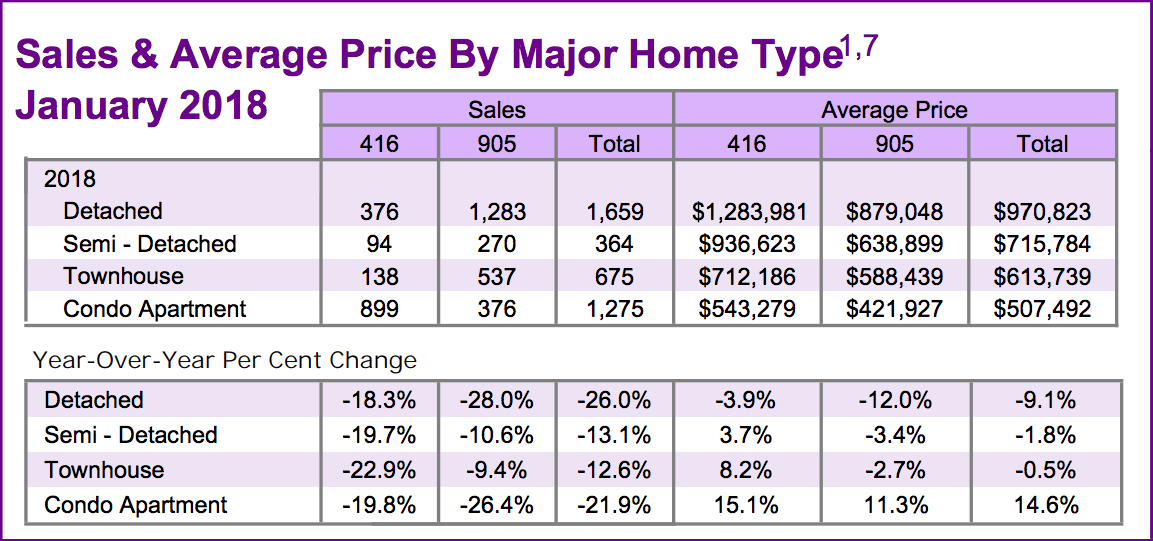
Overall, including all TREB areas and all home types, sales were off 22% compared to last January’s hot market. Average sale prices were also down with the exception of Condo Apartments, Semis and Townhomes within Metropolitan Toronto.
Available inventory continued to rise with Total Active Listings at the end of the month up 136.3% to 11,894. All figures are year-over-year comparisons unless otherwise noted.
It’s also worth noting that last January was a record for what’s an historically slower month with 5,155 sales reported. The overall average price last January was $768,351 compared to $736,783 this January - a 4.1% drop.
Looking at specific housing types…
There were 376 Detached home sales reported in the City of Toronto, an 18.3% drop, at an average sale price of $1,283,981, down 3.9%. In the balance of the GTA, 1,283 Detached sales were reported, down an even 28%, at an average of $879,048, down a hefty 12% from one year ago. That represented an overall 26% drop in sales for the Detached group…and a 9.1% hit to the average price.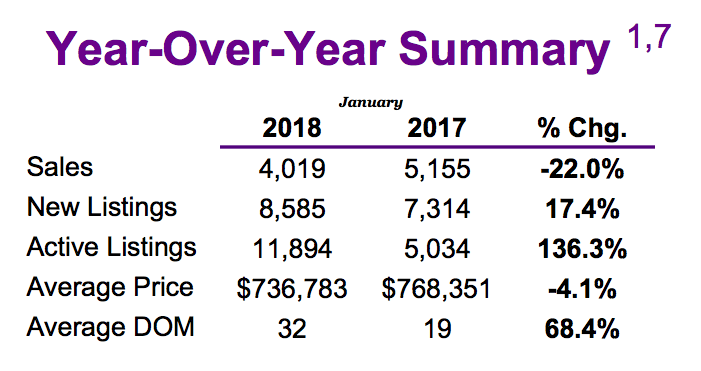
Sales of Semi-Detached homes in Metro Toronto totalled 94 on the month, down 19.7%, at an average of $936,623, up 3.7% - no doubt in part due to the lower price point versus Detached. In “The 905” area code, 270 Semi sales were reported, down 10.6%, at an average selling price of $638,899, off 3.4%.
While Condo Apartments prices were stronger, the number of sales was not, relatively speaking. In Metro Toronto, 899 sales were reported, down 19.8%, at an average price of $543,279, up 15.1%. In the balance of the Greater Toronto Area, 376 sales were reported, down 26.4%, at an average of $421,927, up 11.3%. This trend of falling sales/rising prices - fuelled by the relatively low number of Condo Apartment listings combined with the lower price point for Condos versus Freehold homes - has been intact since last May. There's some relief on the inventory front, though: Overall, Condo Apartment listings are up 33% YoY [2,591 vs 1,946]. In The Big Smoke they're up 18.8% [1,648 vs 1,387]. We'll see if demand increases to support the price trend.
Freehold Inventory continues to rise
As noted above, there were 11,894 Active Listings as of the end of January, a 136.3% increase over last year’s 5,034. Those figures give us a Forward Inventory of 2.96 months…compared to just shy of one month in the days of ridiculously tight inventory twelve short months earlier. The Absorption Rate, or Sales-to-New Listings Ratio, stands at .47 [.71 one year ago].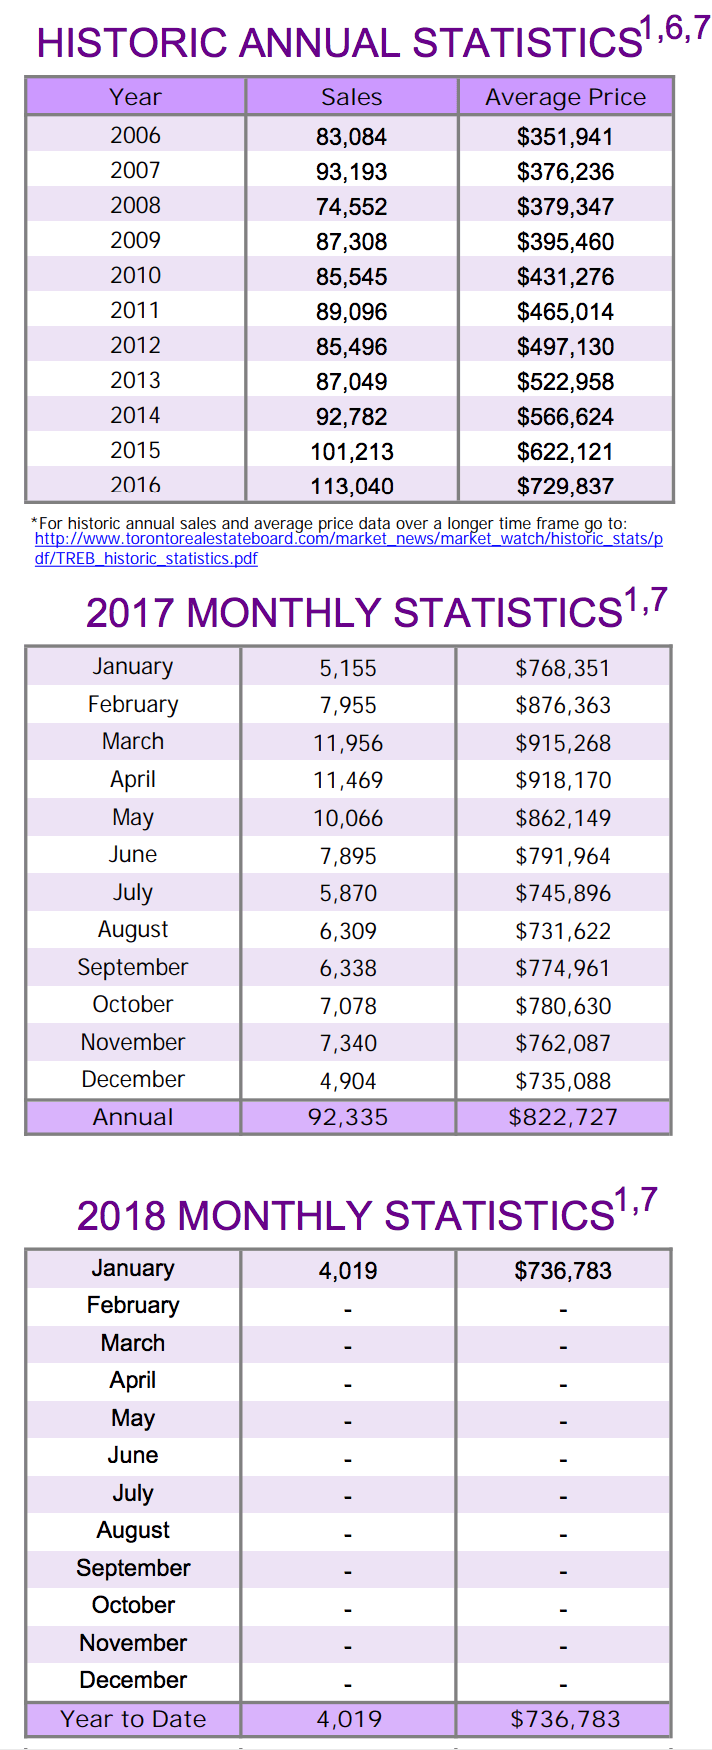
According to Jason Mercer, Director of Market Analysis at TREB, “It is not surprising that home prices in some market segments were flat to down in January compared to last year. At this time last year, we were in the midst of a housing price spike driven by exceptionally low inventory in the marketplace. It is likely that market conditions will support a return to positive price growth for many home types in the second half of 2018. The condominium apartment segment will be the driver of this price growth.”
Adds Board President Tim Syrianos, “TREB released its outlook for 2018 on January 30th. The outlook pointed to a slower start to 2018, especially compared to the record-setting pace experienced a year ago. As we move through the year, expect the pace of home sales to pick up, as the psychological impact of the Fair Housing Plan starts to wane and home buyers find their footing relative to the new OSFImandated stress test for mortgage approvals through federally regulated lenders.”
To nobody’s surprise, homes took “68.4% longer” to sell in January at 32 Days on Market [“DOM”] compared to last January’s 19 days.
Revisiting last spring’s price peak:
Despite the relative strength in Condo Apartment prices, they're still below their 2017 peak along with everything else. Here's a quick synopsis of "then & now" for the major housing types in Toronto and the GTA:
Metro Toronto:
Detached: $1,283,981 / $1,578,542 [2017-04] -18.7%
Semi-Detached: $936,623 / $1,104,047 [2017-04] -15.2%
Townhouse: $712,186 / $793,129 [2017-04] -10.2%
Condo Apartment: $543,279 / $578,280 [2017-04] -6.1%
"The 905" / Balance of the GTA:
Detached: $879,048 / $1,124,088 [2017-03] -21.8%
Semi-Detached: $638,899 / $742,501 [2017-03] -14%
Townhouse: $588,439 / 690,202 [2017-03] -14.7%
Condo Apartment: $421,927 / 449,792 [2017-04] -6.2%
We’ll be posting some more in-depth numbers for specific Towns and Neighbourhoods around the GTA over the coming days and weeks as time permits. Drop us a line if you’d like to be kept apprised or if you’d like an up-to-date statistical snapshot of a specific area…
Set Up Your Own Customized SmartSearch
What's your property worth today?
JustBungalows.com Home Page
Questions? Comments? ...We'd ![]() to hear from you!
to hear from you!
Browse GTA Bungalows by City / Region:
Durham Region | Halton Region | Peel Region | Simcoe County | Toronto by Boroughs | York Region
Browse "Beyond the GTA" Bungalows by City / Region:
Brant & Brantford Township | Dufferin County | Grey County | Guelph & Wellington County | Haldimand County | Haliburton County | Hamilton [City] | Hastings County | Kawartha Lakes | Kitchener-Waterloo & Cambridge | Muskoka District | Niagara Region | Northumberland County | Parry Sound District | Peterborough City & County | Prince Edward County

