
Average prices across the area continue torrid pace YoY
Toronto, Ontario - April 5, 2017 - As Yogi Berra put it, “It’s deja vu all over again.” Only worse. Or better. Depending on whether you're buying or selling... 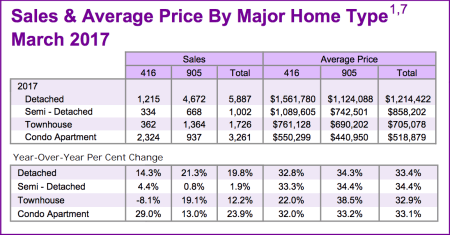
Toronto & GTA Realtors® today released the March, 2017 MLS® home sales figures via the Toronto Real Estate Board’s MarketWatch report. The report reveals a continuation of the long-standing trend, namely spiking prices driven by chronic lack of inventory and intense buyer demand.
Buyers fear being priced out of the market and left behind while some Sellers are sitting tight in hope of still higher prices, many expressing the same sentiment: “Sure we could sell…but where would we go?”
Time to change some rules?
Meanwhile, policy makers debate what, if any, action should be taken to “remedy” the situation: “It has been encouraging to see that policymakers have not implemented any knee-jerk policies regarding the GTA housing market. Different levels of government are holding consultations with market stakeholders and TREB has participated and will continue to participate in these discussions. Policy makers must remember that it is the interplay between the demand for and supply of listings that influences price growth,” said TREB President, Larry Cerqua.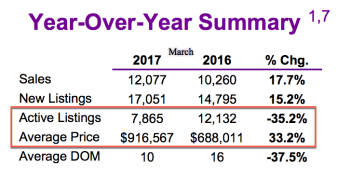
Ideas being considered at meetings and "roundtables" include a new tax on vacant homes in order to slow speculation, among others. And, while real estate boards and associations suggest the answer is simply to increse housing supply to better meet demand, people like BMO's Douglas Porter disagree. Mr. Porter rhetorically asks if the right course of action with past bubbles, including the dot-com boom and America’s own housing bubble, would have been to increase supply. “In each and every case the answer is an emphatic “no!”—the problem was overly exuberant demand.” Interestingly, Mr. Porter about 6 weeks ago was comparing Toronto’s current real estate plight to the crash experienced in the '80s.
The numbers...
One year ago there were 12,132 Active Listings and 10,326 sales - an inventory situation which we then described as “very tight”; “Forward Inventory” stood at “a meagre 1.17months”. Now there are 7,865 Active Listings and 12,077 sales…which means Forward Inventory now sits at just under 3 weeks [“.65 of a month”].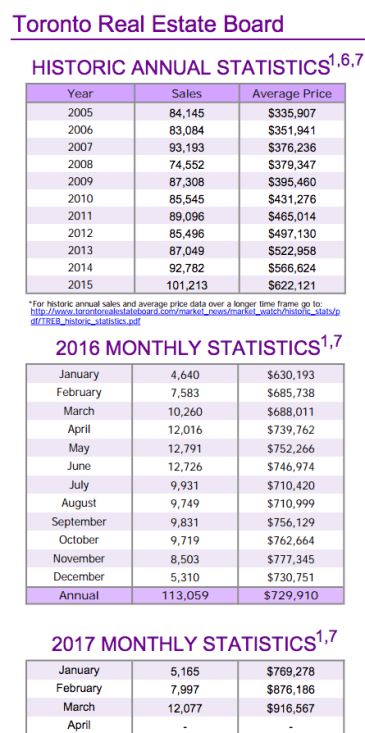
To nobody’s surprise, listings are “flying off the shelves”: Two years ago, in March, 2015, homes took an average of 20 days to sell…which was well below historical norms. Last March that average was “20% faster” at 16 days. This March it’s down to just 10 days on the market, on average [“37.5% faster than last March]. All figures are year-over-year comparisons unless otherwise noted.
Overall, 17.7% more homes sold this March compared to last [12,077 versus 10,260] at an average sale price of $916,567. That’s a stunning 33.2% jump from last March’s $688,011 TREB average [including all areas and all home types].
While Detached homes have been the primary driver in terms of price growth, average prices for all home types in all areas were up in excess of 30% with the exception of Metro Toronto Townhomes. The highest increase was for Townhomes in “The 905” at +38.5% [$690,202] on 1,364 sales, up 19.1%. Just for the record, sales of Townhomes within Metro Toronto actually fell 8.1% to 362 units…which is, no doubt, a function of tight inventory. Metro T.O. average Townhouse prices rose 22% to $761,128.
As for that Detached group, 1,215 sold in Toronto, up 14.3%, at an average sale price of $1,561,780, up 32.8%. 4,672 sold in the balance of TREB’s market area - loosely termed “The 905” - up 21.3%, at an average of $1,124,088, up 34.3%.
Condominium Apartments also had a very strong month with 2,324 units selling in Toronto, up 29%, at an average price of $550,299, up 32%. In the balance of the area, 937 changed hands, up 13%, at an average sale price of $440,950, up 33.2%.
Summing it all up, Jason Mercer, TREB’s Director of Market Analysis said, “Annual rates of price growth continued to accelerate in March as growth in sales outstripped growth in listings. A substantial period of months in which listings growth is greater than sales growth will be required to bring the GTA housing market back into balance…”
Set Up Your Own Customized SmartSearch
What's your property worth today?
JustBungalows.com Home Page
Questions? Comments? ...We'd  to hear from you!
Browse GTA Bungalows by City / Region:
Durham Region | Halton Region | Peel Region | Simcoe County | Toronto by Boroughs | York Region
Browse "Beyond the GTA" Bungalows by City / Region:
Brant & Brantford Township | Dufferin County | Grey County | Guelph & Wellington County | Haldimand County | Haliburton County | Hamilton [City] | Hastings County | Kawartha Lakes | Kitchener-Waterloo & Cambridge | Muskoka District | Niagara Region | Northumberland County | Parry Sound District | Peterborough City & County | Prince Edward County