Toronto, Ontario, December 5, 2017 - aside from the 13.3% drop in the number of homes sold in November compared to the same month a year ago - driven largely by the 19.1 % drop in sales in the Detached group - two numbers in particular pop out of the Toronto Real Estate Board's MarketWatch statistical report released today by President Tim Syrianos showing the residential MLS® results for November, 2017: 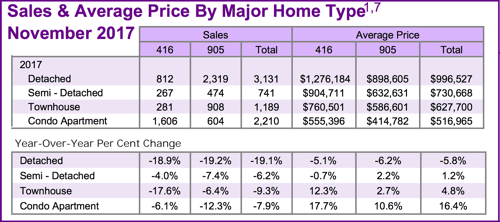
- A massive spike in inventory: the 18,197 active listings figure is just shy of the number of homes available this past May - the heart of the spring market. Significant because we're going into what's traditionally one of the two slowest times of the year for residential real estate [the other being the dog days of summer].
- The overall average price down 2%.
A massive spike in inventory: the 18,197 active listings figure is just shy of the number of homes available this past May - the heart of the spring market. Significant because we're going into what's traditionally one of the two slowest times of the year for residential real estate [the other being the dog days of summer].
The overall average price down 2%.
Those two stats may be wildly divergent but, while the extremity of the first figure speaks for itself, what might be masked by the "little" price drop reflected by the second figure is the fact that it's the first time in nearly a decade that we've seen a negative in the YoY overall average price…not to mention a far, far cry from the $150,000, or 19.5% Bitcoin-ish run-up in just first four months of this year, culminating in the April peak of $918,138.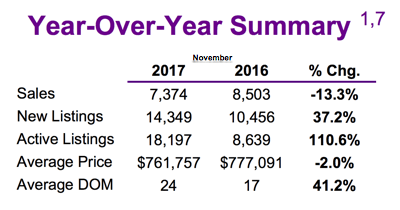
A closer look at the individual numbers [All figures being year-over-year comparisons unless otherwise noted]:
Including all homes types and all TREB market areas there were 7,374 sales in November [-13.3%] at an average selling price of $761,757, [-2%]. The drop in sales was felt hardest in the Detached group: In Metro Toronto, 812 Detached sales represented an 18.9% tumble at an average sale price of $1,276,184, down 5.1%. In the balance of the GTA - the 905 area code - 2,319 sold, down 19.2%, at an average price of $898,605, down 6.2%.
Versus their April, 2017 average price “peak” of $1,578,542, Detached homes in Toronto are down 19.2% or a little more than $300,000. In the balance of the Greater Toronto Area, the price peak for a Detached home actually came in March at $1,124,088. From that point, “905 Detached” average price is off 20.1%, a drop of just over $225,000. Toronto Townhomes also took a significant hit in number sold, down 17.6%, though their average selling price was stronger.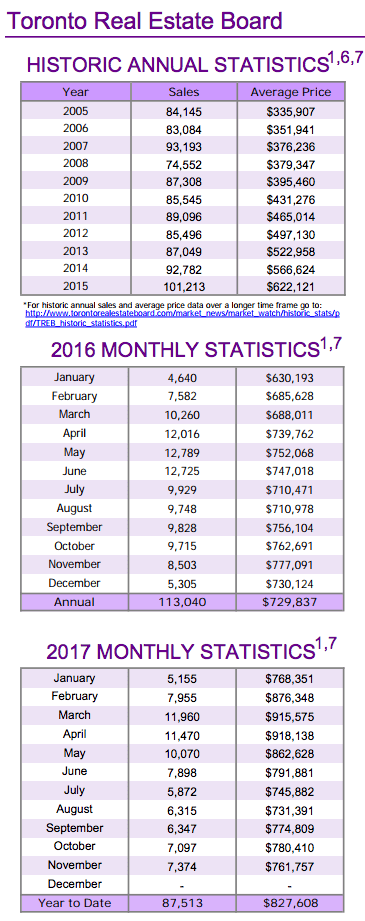
While sales of Condo Apartments were weaker across TREB’s market area, average sale prices were stronger for that group, too: 1,606 sales in Metro Toronto represented a drop of 6.1% at an average price of $555,396, up strongly at +17.7%. As for the rest of the GTA, sales were off 12.3% to 604 units at an average price of $414,782, up 10.6%.
On that inventory spike noted above: This November’s Total Active Listings figure was 18,197, up an incredible 110.6% from last November’s 8,639. Compared to monthly sales, that leaves us with an Indicated Forward Inventory of about two-and-one-half months. While that number’s looking lofty relative to many of the IFI figures over the past year or so, it’s quite in line with historical averages and a much healthier market. What remains to be seen is, in the face of the OSFI’s - Office of the Superintendent of Financial Institutions - new mortgage stress tests, record levels of debt, and potentially rising interest rates in 2018, among other factors, whether or not Forward Inventory stays in that more “balanced” zone or if the pendulum swings into a full-blown buyers’ market…further…as we move into 2018.
The Sales to New Listings Ratio, also known as the Absorption Rate, stood at .514 for November, much weaker than last November’s .813.
It was predicted by many industry watchers that sales in the below-median price ranges would be shored up this fall by the impending mortgage “stress test” rules...and that’s precisely what the TREB November stats appear to bear out.
Not surprisingly, the average home took “41.2% longer to sell” this November at 24 days versus 17.
Jason Mercer, TREB’s Director of Market Analysis, said in the report, “Changes in market conditions have not been uniform across market segments. In line with insights from consumer polling undertaken by Ipsos in the spring, we are still seeing seller’s market conditions for townhouses and condominium apartments in many neighbourhoods versus more balanced market conditions for detached and semi-detached houses. We will have more insights to share about consumer intentions for 2018 at the end of January when TREB releases its third annual Market Year in Review and Outlook report.”
Added Board President Syrianos, “We have seen an uptick in demand for ownership housing in the GTA this fall, over and above the regular seasonal trend. Similar to the Greater Vancouver experience, the impact of the Ontario Fair Housing Plan and particularly the foreign buyer tax may be starting to wane. On top of this, it is also possible that the upcoming changes to mortgage lending guidelines, which come into effect in January, have prompted some households to speed up their home buying decision.”
We’d like to take this opportunity to wish you and yours who celebrate it the Happiest of Holiday Seasons…and an outstanding 2018…
Set Up Your Own Customized SmartSearch
What's your property worth today?
JustBungalows.com Home Page
Questions? Comments? ...We'd ![]() to hear from you!
to hear from you!
Browse GTA Bungalows by City / Region:
Durham Region | Halton Region | Peel Region | Simcoe County | Toronto by Boroughs | York Region
Browse "Beyond the GTA" Bungalows by City / Region:
Brant & Brantford Township | Dufferin County | Grey County | Guelph & Wellington County | Haldimand County | Haliburton County | Hamilton [City] | Hastings County | Kawartha Lakes | Kitchener-Waterloo & Cambridge | Muskoka District | Niagara Region | Northumberland County | Parry Sound District | Peterborough City & County | Prince Edward County

