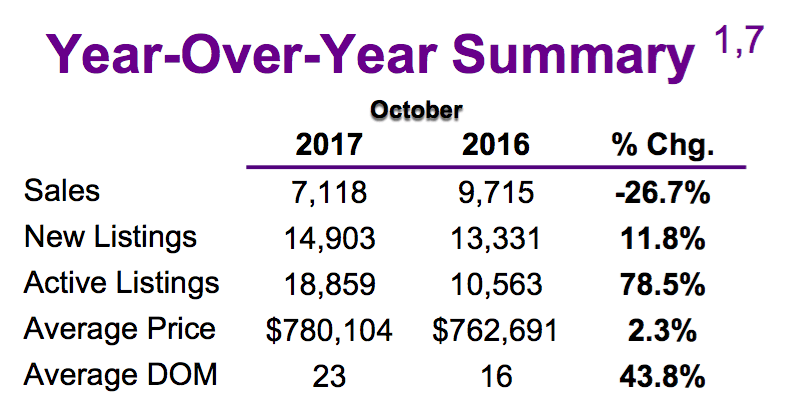
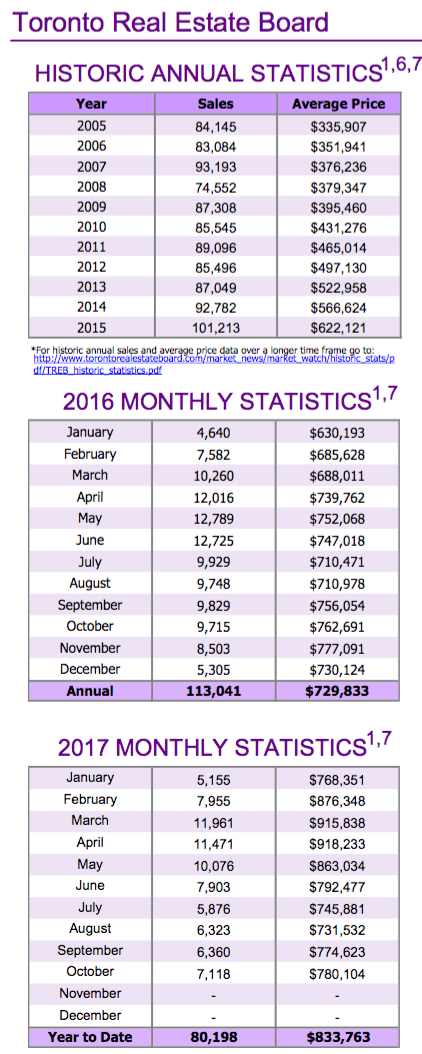
Toronto, Ontario, November 2, 2017 - The Toronto Real Estate Board’s monthly stats report, “MarketWatch” was released this morning showing that Toronto & Greater Toronto Area Realtors® reported, via TREB’s MLS® system, 7,118 residential transactions in October - a slight moderation of the recent trend of much lower sales volume on a year-over-year basis. 
Looking back to March, YoY sales volume was up 17.7% to 12,077 units. By April, coincident with the Ontario Government’s Fair Housing Plan announcement, we had a modest 3.2% year-over-year drop to 11,630 sales. Then May through September brought declines in the YoY sales numbers averaging 33.6% [the most extreme of those was July, ’17’s 40.4% tank…followed closely by June @ -37.3].
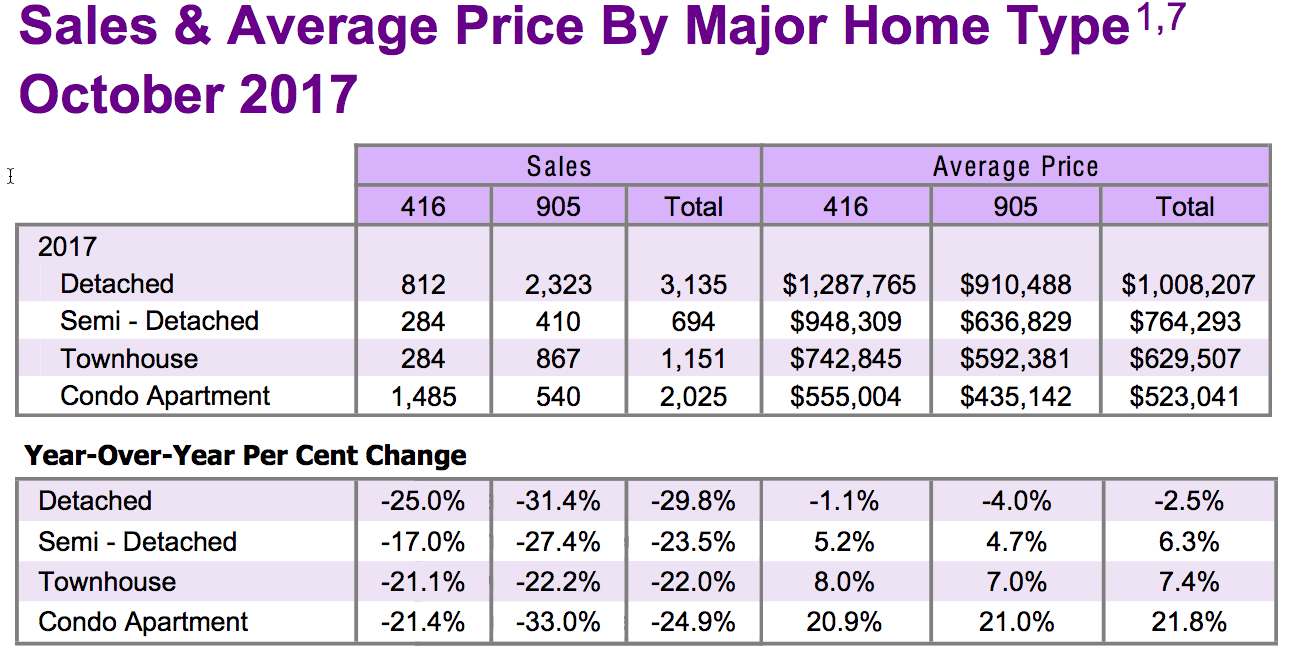
Those October sales represented a 26.7% “softening” - pretty consistent as you can see from the charts - across all TREB market areas and all home types. All figures herein are year-over-year comparisons unless otherwise noted.
As for prices, only the detached sector actually fell - off 2.5% across the area. Semis & Towns posted decent gains while Condo Apartments showed continued strength with another 20% to the upside. With apologies for the reiteration, what needs to be noted, though, is that residential real estate’s seasonal nature generally makes year-over-year comparison the most relevant. Generally. But 2017’s a bit different: It’s been six months now since that first down-tick in sales.
Overall average prices for the four “primary” housing types are all down by varying degrees since their spring peak [peak month; dollar amount in brackets]:
Detached 416: -22.3% [April ; $290,777]
Detached 905: -23.5% [March; $213,600]
Semi-Detached 416: -16.4% [April; $155,738]
Semi-Detached 905: -16.6% [March; $105,672]
Freehold Townhouses 416: -6.8% [April; $50,284]
Freehold Townhouses 905: -16.5% [March; $97,821]
Condo Apartments416: -4.2% [April; $23,276]
Condo Apartments 905: -3.4% [April; $14,650]
Understandably, higher price-point homes have been hit hardest, generally speaking. And, while we saw a price bounce in September compared to August, some watchers have speculated that sales will be positively impacted in this latter portion of 2017 with new mortgage qualification rules set to come into effect on January 1st, 2018.
Beyond that point, many observers fear that those new rules along with a trend toward higher interest rates - not to mention “oversupply” in the Condo Apartment sector - foretell further softening in prices. With those headwinds and - perhaps most importantly - the continued run-up in GTA residential listing inventory [see charts, + commentary below], it’s difficult to see significant price strength looking forward at this point in time. And, to top it all off, governments are looking harder at residential investment properties from standpoints such as reporting of gains on income tax returns and rentals through services such as AirBNB.
Looking specifically at the October statistics…
In Metro Toronto [“The 416” area code], Detached home sales were 812 on the month, down an even 25%, at an average sale price of $1,287,765, down 1.1%. The rest of the GTA - “The 905" - 2,323 Detached home sales were reported, down 31.4%, at an average price of $910,488, down four percent.
Condo Apartment sales remained soft also, down 21.4% to 1,485 units sold in Metropolitan Toronto at an average price of $555,004, up 21.4%. The rest of the Greater Toronto Area, saw 540 Condo Apartment sales, down 33%, at an average sale price of $435,142, up 21%.
As mentioned above, the Total Active Listings continued to rise as owners listed homes to take advantage of price levels at the same time as sales volume is softening: A 78.5% rise in listings compared to the end of October last year [18,859 listings versus 10,563]. New listing were 14,903 in October, +11.8% YoY. The Total Active Listing versus Monthly Sales gives us an indicated “forward inventory” of 2.65 months. Monthly sales versus the actual New Listings gives us an “absorption rate” [Sales to New Listings Ratio] of .478.
Also not surprisingly, homes took much longer to sell in October. “43.8% longer” at 23 days on the market [16 days last October]. Though, by historic standards, an average of 23 DOM is still pretty quick to sell a house.
Toronto Real Estate Board President Tim Syrianos on the October stats report: “Every year we generally see a jump in sales between September and October. However, this year that increase was more pronounced than usual compared to the previous ten years. So, while the number of transactions was still down relative to last year’s record pace, it certainly does appear that sales momentum is picking up.”
And TREB’s Director of Market Analysis, Jason Mercer: “The housing market in the GTA has been impacted by a number of policy changes at the provincial and federal levels. Similar to the track followed in the Greater Vancouver Area, it appears that the psychological impact of the Fair Housing Plan, including the tax on foreign buyers, is starting to unwind.”
Set Up Your Own Customized SmartSearch
What's your property worth today?
JustBungalows.com Home Page
Questions? Comments? ...We'd ![]() to hear from you!
to hear from you!
Browse GTA Bungalows by City / Region:
Durham Region | Halton Region | Peel Region | Simcoe County | Toronto by Boroughs | York Region
Browse "Beyond the GTA" Bungalows by City / Region:
Brant & Brantford Township | Dufferin County | Grey County | Guelph & Wellington County | Haldimand County | Haliburton County | Hamilton [City] | Hastings County | Kawartha Lakes | Kitchener-Waterloo & Cambridge | Muskoka District | Niagara Region | Northumberland County | Parry Sound District | Peterborough City & County | Prince Edward County
