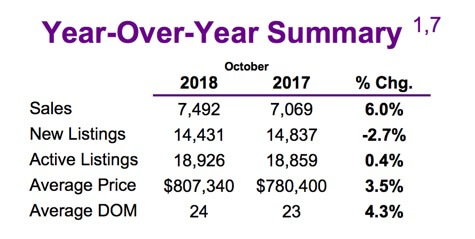
Toronto, Ontario, November 6, 2018 - The Toronto Real Estate Board’s “MarketWatch” monthly stats report was released by TREB this morning with Realtors® in Toronto and the Greater Toronto Area reporting six percent more sale through TREB’s MLS® system compared to last October at 7,492 total [7,069 last October]. Overall average selling price was up 6% - largely on the strength of Condo Apartment prices - to $807,340 [$780,400 a year ago]. All figures herein are year-over-year comparisons unless otherwise noted. 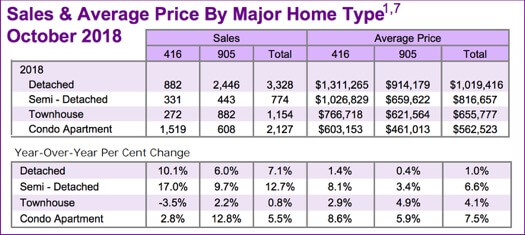
Also of note is that the number of October sales was up about 16% from September, 2018’s 6,455. Based on that sales strength, it’s not surprising that the average selling price was also up month-over-month by over 1.3% [just shy of 16% annualized]. And, while total available inventory was virtually flat YoY, it was down 5.8% MoM. The Detached home group specifically saw a 32.6% jump in sales month-over-month - perhaps benefiting from the combination of softer prices/higher inventory; the lack of inventory on the Condo Apartment side; higher mortgage rates on the horizon at the time; and - likely - a simple case of pent-up demand for homes with back yards as opposed to just balconies.
 Looking more closely at the numbers reveals a pretty “mixed bag” in terms of what’s hot & what’s not. Sales of Detached homes, for example, were strong across the TREB market area. Condo Apartments, though, were up a modest 2.8% in Toronto and a more robust 12.8% in the balance of the GTA. And, while prices were relatively flat for the Detached group, they were significantly stronger for the Condo Apartment sector. Inventory remains low for Condo Apartments, particularly in and around the downtown Toronto area.
Just the Numbers…
Metropolitan Toronto - “The 416” - saw 882 Detached home sales on the month, up a healthy 10.1%, the selling price averaging $1,311,265, a modest 1.4% rise. The rest of the GTA - “The 905”, generally speaking - saw 2,446 Detached sales, up an even 6%, averaging $914,179, all but flat at +0.4%.
As for Metro T.O. Condo Apartments, the number of sales was +2.8% YoY at 1,519 units. The average sale price was $603,153, up 8.6%. The 905 saw 608 sell, up 12.8%, at an average of $461,013, up 5.9%.
Inventory “Stable” YoY
Let’s call overall inventory “stable” - with the apparent exception of the Toronto Condo Apartment segment - as Total Active Listings [TAL] stood at 18,926 as of month-end compared to 8,859 one year earlier. “Newly listed” homes were down 2.7% at 14,431.
“Forward Inventory” - Total Active Listings over Monthly Sales - stood at 2.53 months. That’s still a little 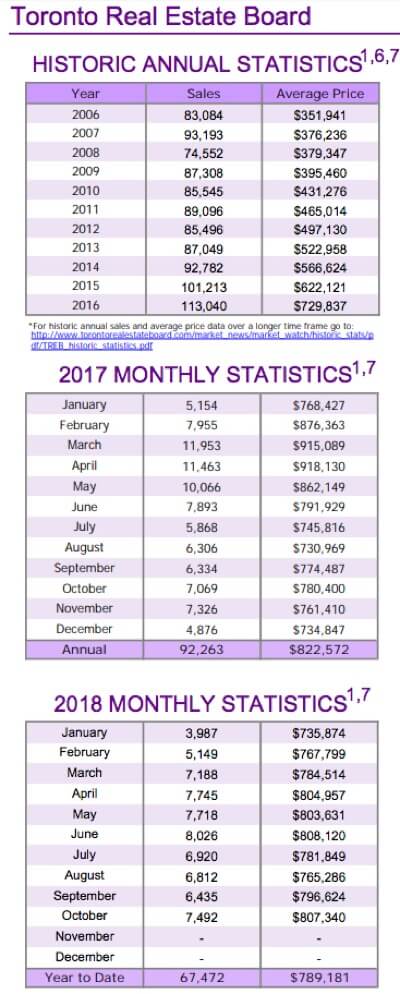 low compared to historical norms. One year earlier we were at 2.65 months. The Absorption Rate - Monthly Sales over New Listings - was .519. A year ago we were at .478.
“Annual sales growth has been positive since the late spring. While the OSFI stress test and higher borrowing costs have kept sales below 2016’s record pace, many households in the Greater Toronto Area remain upbeat on home ownership as a quality long-term investment. A strong regional economy and steady population growth will continue to support the demand for housing ownership as we move into 2019,” said Board President Garry Bhaura.
TREB’s Director of Market Analysis, Jason Mercer, added, “Annual sales growth has outstripped annual growth in new listings for the last five months, underpinning the fact that listings supply remains an issue in the Greater Toronto Area. With municipal elections in the rear view mirror, all levels of government need to concentrate on policies that could remove impediments to a better-supplied housing market, including facilitating the development of a broader array of medium density housing choices.”
Days on Market - the time it took to sell the average home in the GTA - was 24 in October. That’s almost the same as last October’s 23 days and - again - well beneath the historical average. As we’ve noted here before, however, the DOM figure has to be taken with a grain of salt from an historical perspective given the practice in recent years of terminating listings and re-writing them “anew” as opposed to simply “editing” a listing. The terminate/re-write practice is now often utilized where the asking price is being reduced or simply to “freshen up” a listing that’s been on the market for awhile. Obviously the newer practice shortens the average time it takes to sell from a statistical standpoint.
Set Up Your Own Customized SmartSearch
What's your property worth today?
JustBungalows.com Home Page
Questions? Comments? ...We'd ![]() to hear from you!
to hear from you!
Browse GTA Bungalows by City / Region:
Durham Region | Halton Region | Peel Region | Simcoe County | Toronto by Boroughs | York Region
Browse "Beyond the GTA" Bungalows by City / Region:
Brant & Brantford Township | Dufferin County | Grey County | Guelph & Wellington County | Haldimand County | Haliburton County | Hamilton [City] | Hastings County | Kawartha Lakes | Kitchener-Waterloo & Cambridge | Muskoka District | Niagara Region | Northumberland County | Parry Sound District | Peterborough City & County | Prince Edward County

