
Toronto, Ontario, October 4, 2017 - The Toronto Real Estate Board’s monthly residential market statistics report, “MarketWatch”, was released this morning showing 6,379 residential property sales reported through TREB’s MLS® system by Toronto & GTA Realtors® last month, down 35.1% - the fifth month in a row for very significant drops in sales activity. That said, only the Detached homes group in “The 905” actually dropped in price [and not by much] - despite the very soft sales volume. 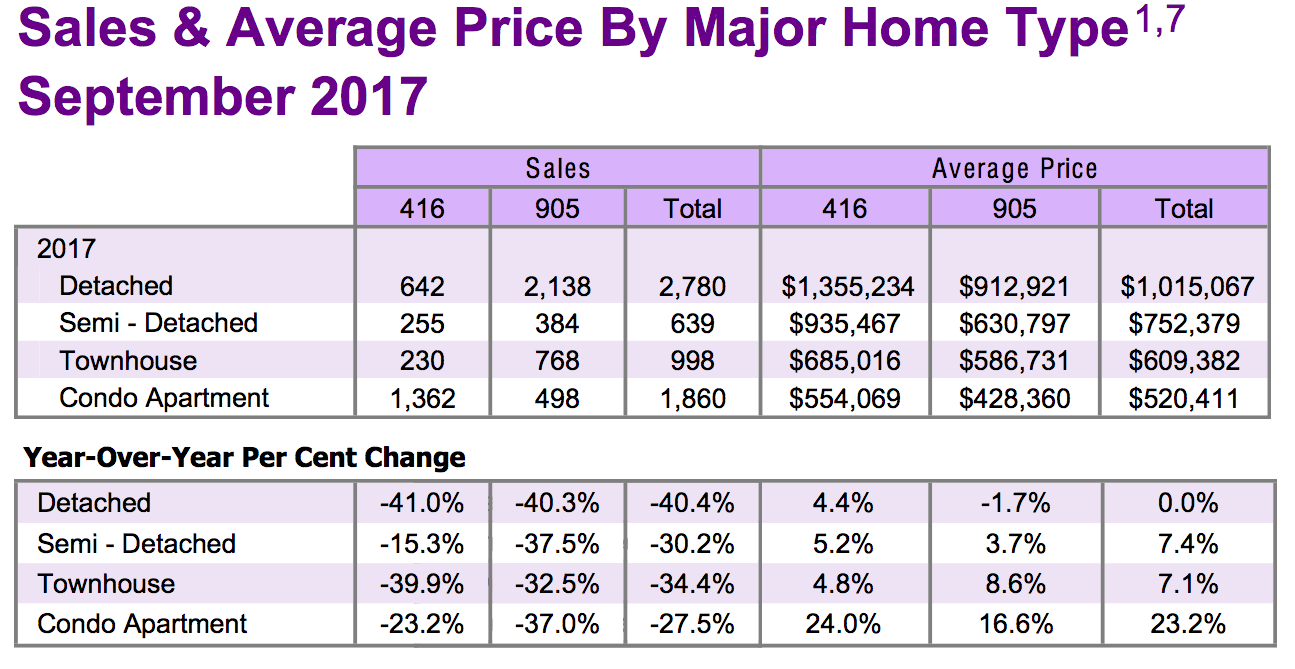
All figures quoted are year-over-year comparisons unless otherwise noted.
TAL - or Total Active Listings - the best indicator of market supply [in our opinion] continued to romp higher, this time up 69% to 19,021 listings [11,255 listings were on the market at the same point in time last year].
The City of Toronto - “The 416” - saw just 642 Detached homes sell, down an even 41%, at an average of $1,355,234, up 4.4%. In the rest of the Greater Toronto Area - “The 905" - 2,138 Detacheds went under contract in June, down 40.3%, at an average of $912,921, off 1.7%.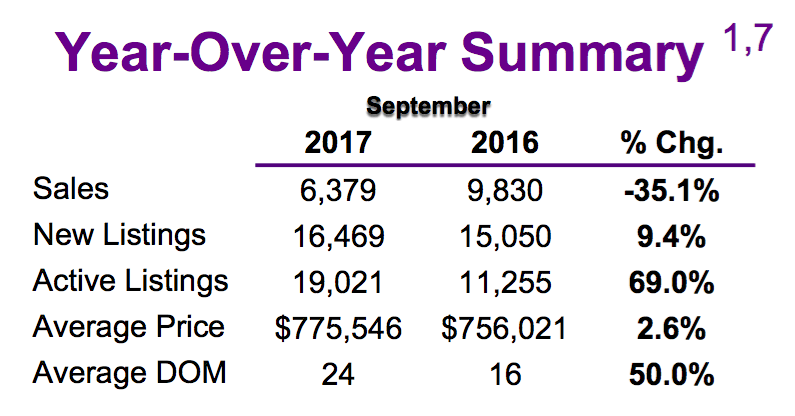
Condo Apartment sales were also much softer once again, though not to the degree the Freehold group was, and that Condo group also managed to maintain very strong price growth in spite of the weak volume numbers, maintaining the trend of recent months. In T.O. itself, 1,362 Condo Apartments sold, off 23.2% versus September, 2016, at an average sale price of $554,069, up 24%. In the balance of the GTA, 498 Apartments sold, down 37%, at an average price of $428,360, up 16.6%.
Please note that these apparently robust Condo Apartment prices are still down from the April, ’17 “peak” at which point the were $578,280 and $449,792 [down 4.4% and 5% respectively].
It took “50% longer” to sell a residential property in TREB’s market area in September compared to last September at 24 days on the market [“DOM”] versus 16.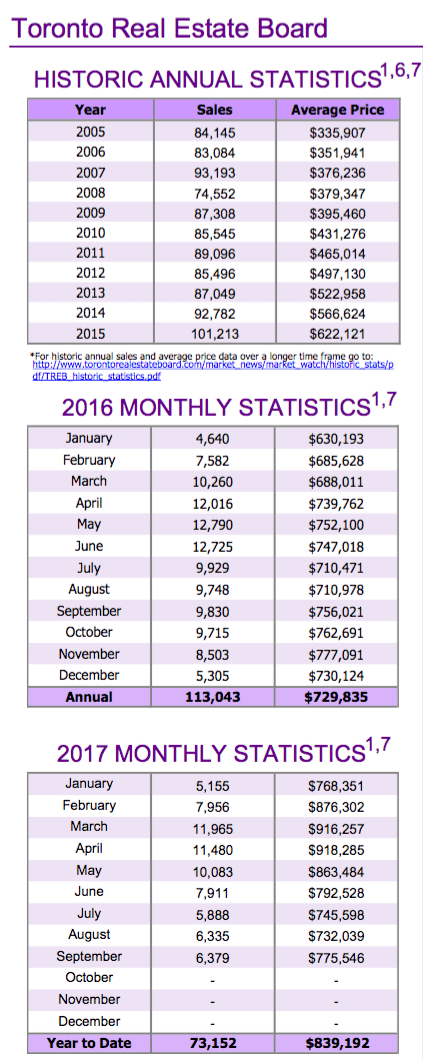
“The improvement in listings in September compared to a year earlier suggests that home owners are anticipating an uptick in sales activity as we move through the fall. Consumer polling undertaken for TREB in the spring suggested that buying intentions over the next year remain strong. As we move through the fourth quarter we could see some buyers moving off the sidelines, taking advantage of a better-supplied marketplace,” said Toronto Real Estate Board President Tim Syrianos.
From Jason Mercer, TREB’s Director of Market Analysis, “With more balanced market conditions, the pace of year-over-year price growth was more moderate in September compared to a year ago. However, the exception was the condominium apartment market segment, where average and benchmark sales prices were up by more than 20 per cent compared to last year. Tighter market conditions for condominium apartments follows consumer polling results from the spring that pointed toward a shift to condos in terms of buyer intentions.”
Set Up Your Own Customized SmartSearch
What's your property worth today?
JustBungalows.com Home Page
Questions? Comments? ...We'd  to hear from you!
Browse GTA Bungalows by City / Region:
Durham Region | Halton Region | Peel Region | Simcoe County | Toronto by Boroughs | York Region
Browse "Beyond the GTA" Bungalows by City / Region:
Brant & Brantford Township | Dufferin County | Grey County | Guelph & Wellington County | Haldimand County | Haliburton County | Hamilton [City] | Hastings County | Kawartha Lakes | Kitchener-Waterloo & Cambridge | Muskoka District | Niagara Region | Northumberland County | Parry Sound District | Peterborough City & County | Prince Edward County