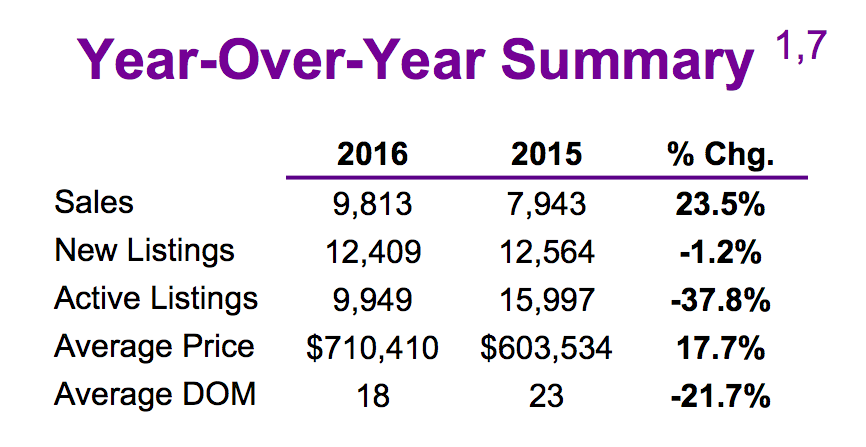
Toronto, Ontario - September 7, 2016 - Toronto and GTA/Greater Toronto Area Realtors® today released the August, 2016 residential sales statistics showing August was another record month with 9,813 homes sold through the Toronto Real Estate Board’s MLS® System, up 23.5% compared to August 2015. All comparisons herein are year-over-year, unless otherwise noted. 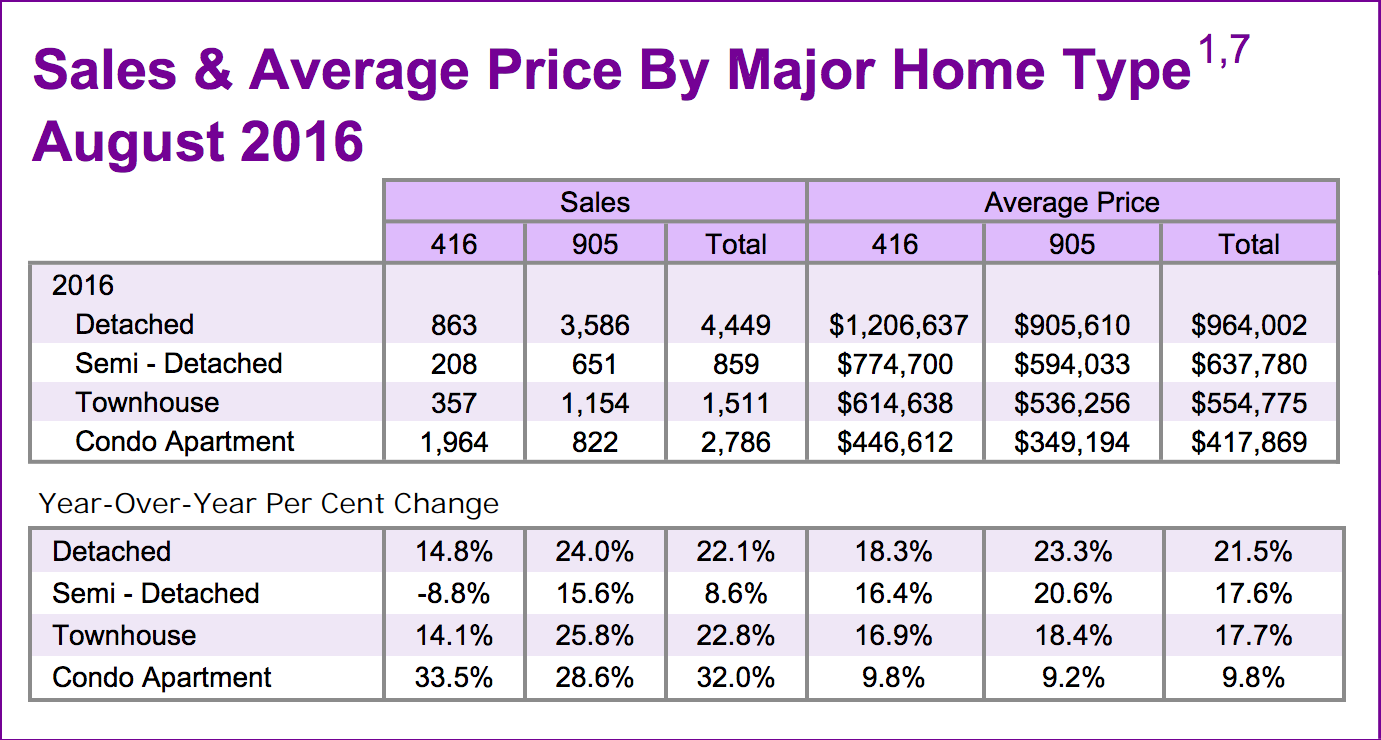
The Board points out that there were two fewer business days last August compared to this August and, because most sales are reported on business days, if those two days are factored out that volume increase is closer to 13%. No doubt he "real" increase lies somewhere between those two figures.
Regardless, it was yet another very strong month for home sales in Toronto and the GTA. The average selling price of those sales -including all TREB areas and all housing types - rose 17.7% to $710,410; an increase in the average price of about $107,000 in twelve months.
With the exception of the number of Semi-Detached homes sold in Metropolitan Toronto, sales volume and price increases were strong across the board. While increases in average prices were strongest among the Freehold home types, the number of Condo Apartments sold through the MLS® spiked 32% year-over-year.
 Sales of Detached homes in Metro Toronto rose 14.8% to 863 units [and August, 2015’s figure of 756 units was an 8.5% drop from August 2014 - perhaps a function of limited inventory - though that situation persists]. This August, the average sale price for that Metro Toronto Detached group was $1,206,637, an 18.3% rise. In the balance of the GTA, Detached resales jumped 24% to 3,586 units at an average sale price of $905,610, a 23.3% jump year-over-year. That drop in sales of Semi-Detached homes in Metro Toronto is more likely an issue of supply than anything else: sales of Semis rose 15.6% in the balance of the GTA to 651 units at an average price of $594,033, up 20.6% [within Metro T.O., Semi-Detached resales fell 8.8% to 208 units at an average sale price of $774,700, up 16.4%].
Sales of Condominium Apartments in Metro Toronto rocketed ahead 33.5% to 1,964 units at an average sale price of $446,612, up 9.8%. In the balance of the GTA, Condo Apartment sales were up 28.6% to 822 units at an average sale price of $349,194, up 9.2%.
Freehold Townhome MLS® sales rose 14.1% in Metro Toronto to 357 units at an average price of $614,638, up 16.9%. In the balance of the GTA, sales of “Towns” saw a 25.8% rise to 1,154 units at an average sale price of $536,256, up 18.4%.
Bungalows in Toronto and the GTA continue to be very popular with Buyers. In Metro Toronto in the second half of August, for example, sales of Bungalows were up 21.5% over the same period one year earlier. The average sale price of those Bungalows was up 22.7% and they went, on average, for 8.3% over the MLS® listing price. The average time it took to sell a Toronto Bungalow was 11 days during that period.
Tight Inventory Situation Persists
In August of 2014, the number of Total Active Listings on the Toronto MLS® system stood at 17,882. By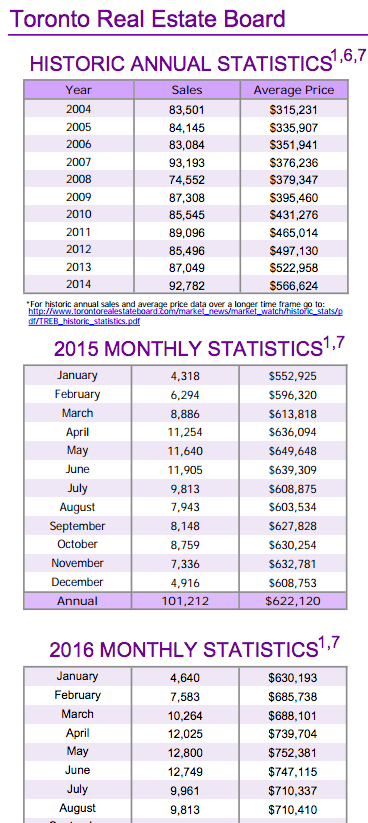 last August that inventory figure was down to 15,997, a 10.5% drop. That figure for August, 2016, was down to 9,949 available listings - a 37.8% drop compared to the year earlier. That's only one month of forward inventory. With demand continuing so strong and borrowing rates continuing so low, it's not hard to figure out why prices continue to rise at this rate…which is, obviously, unsustainable in the bigger picture.
It also comes as no surprise that the overall average time it took to sell a home was "21.7% faster" at 18 days on the market ["DOM"] compared to 23 days last August.
According to Jason Mercer, the Toronto Real Estate Board’s Director of Market Analysis, “Population in the GTA continues to grow. The resulting growth in households coupled with favourable economic conditions and low borrowing costs means that we remain on track for another record year for home sales. Against this backdrop, TREB will also be releasing new third-party research, and consumer and REALTOR® survey results throughout the fall and winter, with discussions focusing on foreign buying activity and issues affecting the supply of ownership housing.”
Set Up Your Own Customized SmartSearch
What's your property worth today?
JustBungalows.com Home Page
Questions? Comments? ...We'd
Browse GTA Bungalows by City / Region:
Durham Region | Halton Region | Peel Region | Simcoe County | Toronto by Boroughs | York Region
Browse "Beyond the GTA" Bungalows by City / Region:
Brant & Brantford Township | Dufferin County | Grey County | Guelph & Wellington County | Haldimand County | Haliburton County | Hamilton [City] | Hastings County | Kawartha Lakes | Kitchener-Waterloo & Cambridge | Muskoka District | Niagara Region | Northumberland County | Parry Sound District | Peterborough City & County | Prince Edward County

