Toronto, February 4, 2016 - Whoa! Where went January? Here we are already past “Gopher Day"… 6 weeks ago we were doing “last minute shopping”. [Well…some of us were…]. Scary.
 But!... The residential real estate market chugged on with 4,672 homes sold in Toronto and the GTA in January 2016 - an 8.2% rise year-over-year.
“It is clear that the handoff from 2015 to 2016 was a strong one. This is not surprising given that recent polling conducted for TREB by Ipsos suggested 12% of GTA households were seriously considering the purchase of a home in 2016….”, Toronto Real Estate Board President Mark McLean said in the report released yesterday.
This market is obviously driven to a large degree by the combination of historically low interest rates and very tight inventory - particularly in the Detached and other “low-rise“ home styles.
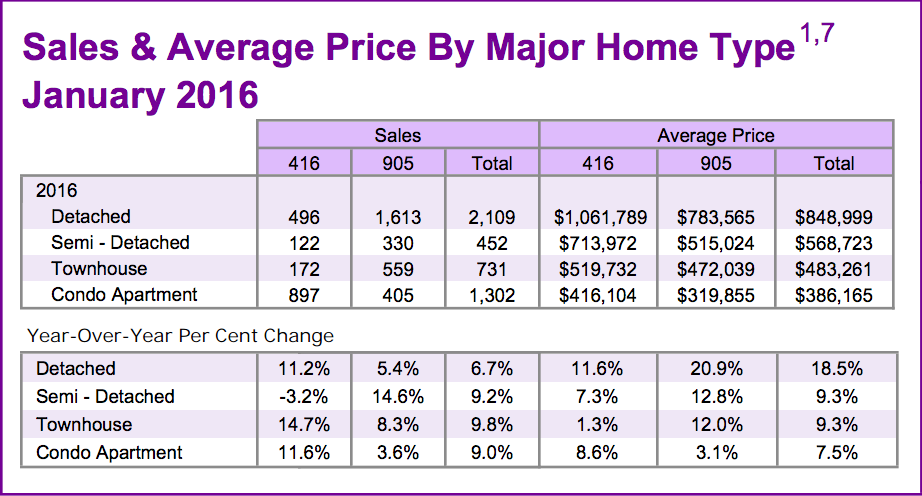
Despite that tight inventory, however, sales of Detached homes in “The 416” jumped 11.2% compared to January 2015 with 496 units trading this January. In “The 905”, there were 1,613 Detached homes sold in January, a 5.4% rise. Average prices for those Detached sales were $1,061,789 in Metropolitan Toronto, an 11.6% rise, and $783,565 in the balance of the GTA: That’s a 20.9% rise year-over-year for the Detached group in the regions surrounding the City of Toronto. [See the last paragraph re: sales of higher-end homes].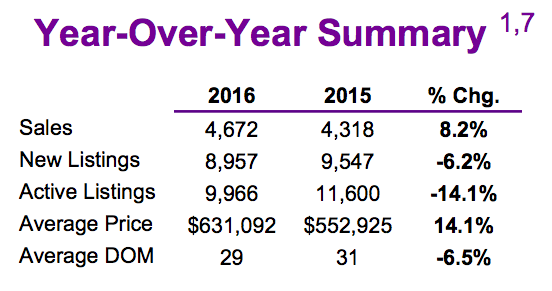
Overall then, for the entire area, Detached home sales rose 6.7% to 2,109, and jumped 18.5% in average price to $848,999.
Sales of Semi-Detached homes in Metro Toronto actually fell 3.2% to 122 units, but that's more likely an issue of inventory than demand: prices for those units rose 7.3% year-over-year to $713,972. [In the balance of the GTA, sales of Semis rose 14.6% to 330 units at an average price of $515,024, up 12.8%].
Sales of Condo Apartments were strong in Metro Toronto, up 11.6% to 897 units at an average price of $416,104 - an 8.6% gain. In the rest of the GTA, Condo Apartment sales rose 3.6% to 405 units at an average price of $319,855, up 3.1%.
As noted above, inventory remains very tight. The number of Total Active Listings at the end of January was 9,966, off 14.1% from 11,600 at the same time last year. Dividing that figure by the total sales for the month [4,672] we get an “indicated forward inventory” of 2.13 months. Two years ago [January, 2014], that forward inventory figure was 2.88 months [11,903 active listings versus 4135 sales]. Last January it was at 2.66 months [11,600 active listings / 4355 sales].
Not surprisingly, homes sold "6.5% faster" this January compared to last: 29 days on the market this year versus 31 last year.
We don’t pay a lot of attention to the “HPI”, but the report did note that higher end homes in “The 905” significantly weighted the average price figure in January: “The MLS® Home Price Index Composite Benchmark Price for January 2015 was up by 11.2 per cent on a year-over-year basis. The average selling price over the same period was up by 14.1 per cent. The difference in the annual growth rates for the MLS® HPI and average price was largely due to a greater share of high-end detached homes sold in the regions surrounding the City of Toronto [emphasis added] this year compared to last. The MLS® HPI removes the impact of shifts in the share of different property types sold from one year to the next.”
Set Up Your Own Customized SmartSearch
What's your property worth today?
JustBungalows.com Home Page
Questions? Comments? ...We'd ![]() to hear from you!
to hear from you!
Browse GTA Bungalows by City / Region:
Durham Region | Halton Region | Peel Region | Simcoe County | Toronto by Boroughs | York Region
Browse "Beyond the GTA" Bungalows by City / Region:
Brant & Brantford Township | Dufferin County | Grey County | Guelph & Wellington County | Haldimand County | Haliburton County | Hamilton [City] | Hastings County | Kawartha Lakes | Kitchener-Waterloo & Cambridge | Muskoka District | Niagara Region | Northumberland County | Parry Sound District | Peterborough City & County | Prince Edward County

