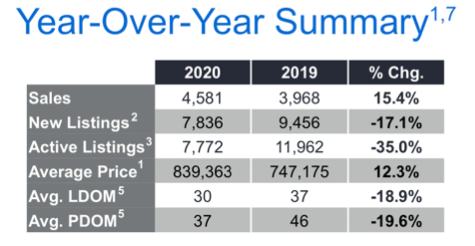
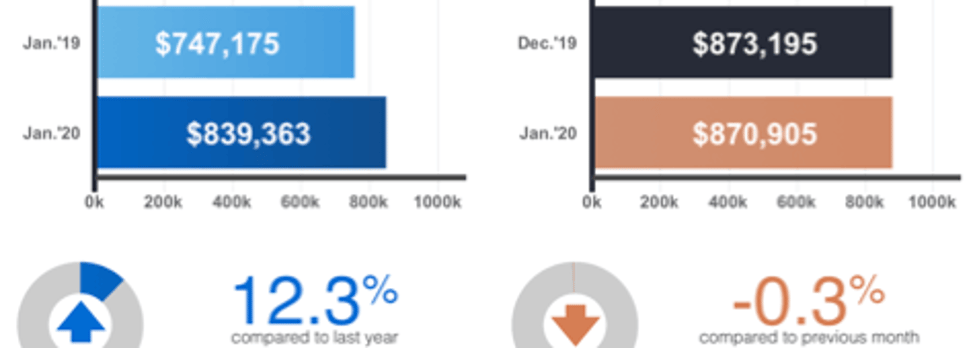
Toronto, Ontario, February 6, 2020 - Michael Collins, President of the Toronto Region Real Estate Board [formerly known as simply "Toronto Real Estate Board"] this morning released the board’s 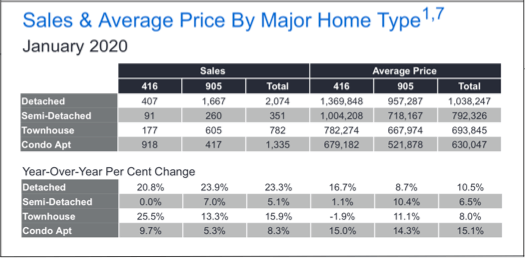 monthly “MarketWatch” statistical update which showed that Metropolitan Toronto and Greater Toronto Area Realtors® reported 4,581 home sales TREB’s MLS® System on the month - a healthy 15.4% rise from last January’s 3,968.
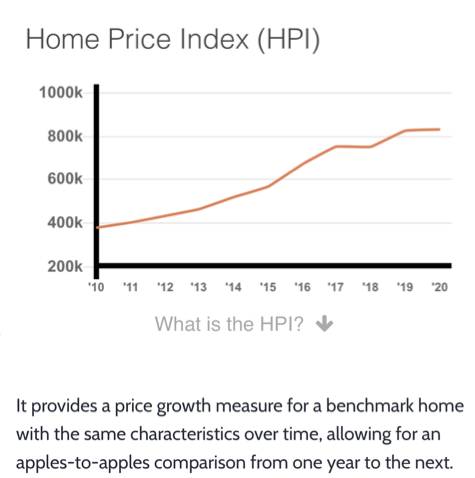
The overall - meaning all housing types across all TRREB market areas - average selling price of those sales was $839,363, up 12.3% from the year-earlier period. [All figures herein are year-over-year comparisons, unless otherwise noted.]
 Note
Note: If you want to be kept up-to-date on what’s going on in your own neighbourhood, go to the
NeighbourhoodUpdate page - you’ll have local intel at your fingertips before many of the agents do,
including the "Solds".
Specifics...
Detached houses across TRREB’s market area saw robust sales volume growth. In Metro Toronto - “The 416” - 407 Detached homes sold firm, a 20.8% jump, at an average sale price of $1,369,848, up 16.7%. In the balance of the GTA - “The 905” [area code] - 1,667 Detached homes sold, up 23.9%, averaging $957,287.
In case you’re wondering, the “price peaks” for the Detached group...the “all time highs” oh-so long ago in the
Spring of ‘17 were
$1,124,088 in “The 905” in
March, 2017, and
$1,578,452 in Toronto in
April of that year.
One oddity in the report:
Sales of Townhomes in The Big Smoke, a.k.a.
Metro T.O.,
jumped 25.5%... But the average selling price for those dropped 1.9%. Go figure. Maybe there were a couple of particularly expensive “Attacheds” sold last January...or a couple of particularly cheap ones sold this January...unlikely...
On the Condominium Apartment front, 918 sold in Metro Toronto, up 9.7%, averaging $679,182, up strongly at +15%. In the rest of TRREB’s market area, 417 sold, up 5.3%, at an average of $521,878, also up relatively strongly at +14.3%.
Inventory Remains a major issue
Yet again, the inventory story is grim and - without a doubt - the largest driver of stats like price growth and DOM [Days on Market - simply the time it takes to sell house] - obviously much shorter in a market where there’s still good demand buut scant supply. Incidentally, TRREB now includes both the LDOM and PDOM figures in the Year-Over-Year summary chart included herein. Here’s an explanation of those two stats and the difference between them:
“Average Listing Days on Market (Avg. LDOM) refers to the average number of days sold listings were on the market. Average Property Days on Market (Avg. PDOM) refers to the average number of days a property was on the market before selling irrespective of whether the property was listed more than once by the same combination of seller and brokerage during the original listing contract period.”
The importance of reporting both figures ties to something
we’ve discussed here many times before, namely the practice of terminating a listing and “re-writing” it - often coincident with a price reduction [but not always - sometimes it's simply a means of “freshening up” a listing that’s been on the market for awhile] - and, given that re-writing of listings was relatively rare in past years, how that practice has had a significant impact on two of the basic statistics in the TRREB report:
- Days on Market is distorted since it only takes into account the most recent listing [e.g. the one that actually “sold”] even though the property may have been on the property many months. The “new” PDOM figure is, therefore, more representative and closer to historically accurate from a comparison standpoint.
- More importantly, that “rewrite” practice has greatly distorted the “New Listings” statistic. All those re-written listings appear as “New” but are not really new to the market at all. For that reason we’ve long maintained that the more representative figure is the TAL - or [Total] Active Listings figure.
- Note that last phrase: That means the DOM numbers still are not an accurate reflection: Often
 properties are listed by a different Brokerage if they don't sell, though not as often "during the original listing contract period". Anyway - not to belabour the point...it's more accurate than it was.
Which brings us to this: In a marketplace already starved for inventory, the TAL figure for January was 7,772 homes on the market. That’s a crushing 35% “tank” from
last January’s 11,962. That latter print was virtually unchanged from
January 2018.
We’d also love to report that there’s been an increase in the number of
Bungalows for sale in Toronto and the Greater Toronto Area but, given the overall inventory figures plus the fact that
the “one storey” is far and away the most popular style of home at the moment, alas... it wasn't to be.
But if you are
looking for a Bungalow anywhere in South-Central Ontario, do drop us a line: We have a very robust database of Bungalow Buyers and Sellers and we’ve partnered with
many of the very best agents in the Region in order to bring our clients the very best in service and uncompromising integrity. Just let us know what you’re looking for and we’ll do our utmost to “pull it out of the hat” for you!
Overall,
Forward Inventory [Active Listings / Monthly Sales] stood at 1.7 months. It was nearly twice that a year ago, and down to was mere weeks in early 2017 - though prices were rising then in the +30% range YoY. Three years ago, in
January of 2017 [wow, that seems SO long ago!], inventory had dropped 50% from
the prior January and Forward Inventory was less than a month. It got worse before it got better. Could we be in for a repeat?
The Absorption Rate - the rate at which the market’s “absorbing” new inventory - is calculated as Monthly Sales / New Listings. It was .585 if you’re interested.
From the Report…
“We started 2020 where 2019 left off, with very strong growth in the number of sales up against a continued dip in the number of new and available listings. Tighter market conditions compared to a year ago resulted in much stronger growth in average selling prices. Steady population growth, low unemployment and low borrowing costs continued to underpin substantial competition between buyers in all major market segments.” - Board President Michael Collins.
“A key difference in the price growth story in January 2020 compared to January 2019 was in the low-rise market segments, particularly with regard to detached houses. A year seems to have made a big difference. It is clear that many buyers who were on the sidelines due to the OSFI stress test are moving back into the market, driving very strong year-over-year sales growth in the detached segment. Strong sales up against a constrained supply continues to result in an accelerating rate of price growth.” - Jason Mercer, TRREB’s Director of Market Analysis and Service Channels.
The Bottom Line: We’re here for YOU...
 to hear from you!